PROTECTED SOURCE SCRIPT
Aktualisiert Monthly Pattern Analysis (15 Years Historical View)
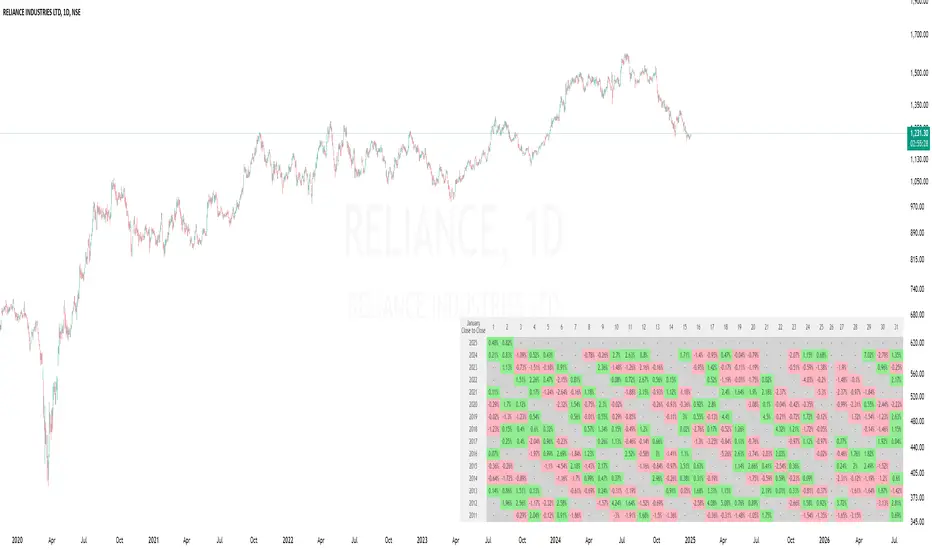
Monthly Pattern Analysis (15 Years Historical View)
This indicator creates a comprehensive visual matrix showing daily percentage changes for any selected month across the last 15 years. Perfect for analyzing historical patterns and seasonality in price movements.
Features:
- Month Selection: Choose any month to analyze (defaults to current month)
- 15-Year History: Shows data from current year back to 15 years
- Flexible Calculations: Choose between "Close to Close" or "Open to Close" percentage changes
- Color-Coded Returns: Green for positive returns, Red for negative returns
- Customizable Display: Adjust table size, position, and colors
- Daily Granularity: Shows changes for each trading day of the selected month
Usage:
1. Apply to any daily chart
2. Select your desired month from settings
3. Choose calculation method (Close-to-Close or Open-to-Close)
4. Customize table appearance as needed
Perfect for:
- Seasonal pattern analysis
- Historical performance comparison
- Month-specific trading strategies
- Long-term market behavior study
Note: Indicator requires Daily timeframe for accurate calculations.
Versionshinweise
Table size changed to small to display in the available screen size, can be changed to Normal or Large as per the requirement from the Indicator settings.Geschütztes Skript
Dieses Script ist als Closed-Source veröffentlicht. Sie können es kostenlos und ohne Einschränkungen verwenden – erfahren Sie hier mehr.
Haftungsausschluss
Die Informationen und Veröffentlichungen sind nicht als Finanz-, Anlage-, Handels- oder andere Arten von Ratschlägen oder Empfehlungen gedacht, die von TradingView bereitgestellt oder gebilligt werden, und stellen diese nicht dar. Lesen Sie mehr in den Nutzungsbedingungen.
Geschütztes Skript
Dieses Script ist als Closed-Source veröffentlicht. Sie können es kostenlos und ohne Einschränkungen verwenden – erfahren Sie hier mehr.
Haftungsausschluss
Die Informationen und Veröffentlichungen sind nicht als Finanz-, Anlage-, Handels- oder andere Arten von Ratschlägen oder Empfehlungen gedacht, die von TradingView bereitgestellt oder gebilligt werden, und stellen diese nicht dar. Lesen Sie mehr in den Nutzungsbedingungen.