OPEN-SOURCE SCRIPT
UCS_TTM_Wave A & B & C
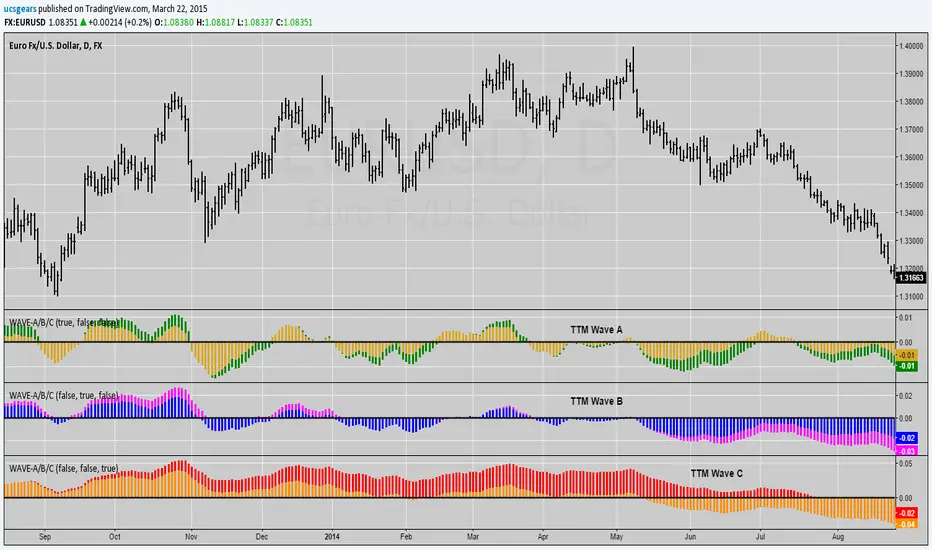
This is a replica of TTM Wave A B C.
The ABC Waves are comprised of various moving averages and oscillators (MACD) used to visualize the overall strength and direction of a given market across multiple time frames.
The “A Wave” measures short term relative strength and direction of a market, the “C Wave” measures longer term strength and the “B Wave” plots the same for a medium time period.
Here is the link to the ACTUAL Indicator - members.simpleroptions.com/options-trading-indicators/abcwaves/
Instruction -
Load the Indicator three times, Turn Off the Other two Waves. For eg., Wave A - Check / Wave B - Uncheck / Wave C - Uncheck. = This will plot Wave A.
Open-source Skript
Ganz im Sinne von TradingView hat dieser Autor sein/ihr Script als Open-Source veröffentlicht. Auf diese Weise können nun das Script auch andere Trader verstehen und prüfen. Vielen Dank an den Autor! Sie können das Script kostenlos verwenden. Die Nutzung dieses Codes in einer Veröffentlichung wird in unseren Hausregeln reguliert. Sie können es als Favoriten auswählen, um es in einem Chart zu verwenden.
Uday C Santhakumar
Haftungsausschluss
Die Informationen und Veröffentlichungen sind nicht als Finanz-, Anlage-, Handels- oder andere Arten von Ratschlägen oder Empfehlungen gedacht, die von TradingView bereitgestellt oder gebilligt werden, und stellen diese nicht dar. Lesen Sie mehr in den Nutzungsbedingungen.