[PATAlgo] Index Options (v2)
This advanced indicator is engineered to empower traders with real-time insights into market trends and price dynamics. Through sophisticated algorithms and cutting-edge functionalities, it provides a competitive edge, enabling users to stay ahead of market curves and make well-informed trading decisions.
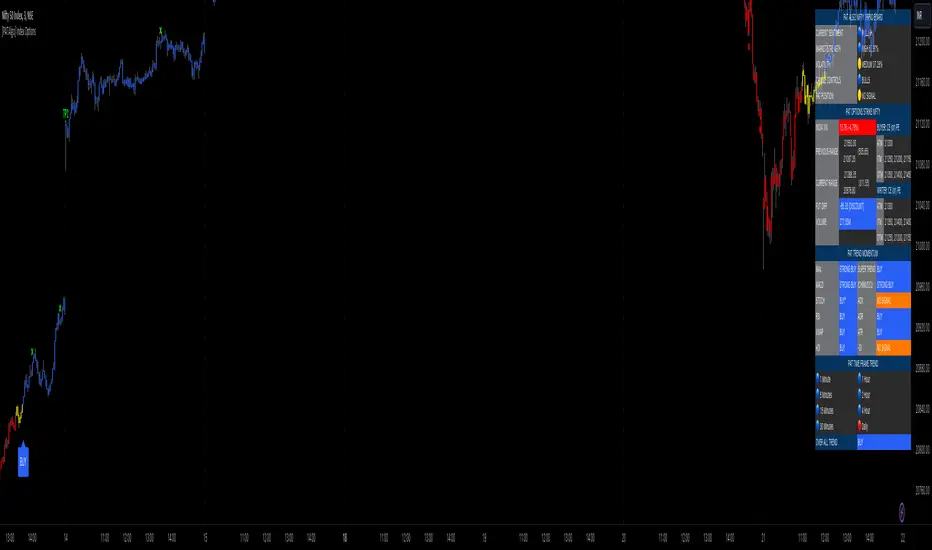
One of the standout features of PATAlgo Index Options is its chart and candle analysis setup, facilitating pattern identification and aiding traders in making prudent decisions. Below, we delve into the core features of this indicator suite, offering a detailed explanation of its functionalities.
1. PAT Signals:
Signal Mode: Tailored to trader styles, accommodating scalpers, swing traders, and positional traders.
Signal Reactivity: Allows customization for signal frequency, with settings ranging from 1.2 to 6.
Signal Strength: Defines signal intensity on a scale from 1 to 10.
2. PAT Trace:
A trend-tracing tool effective across all time frames, particularly beneficial for scalpers and swing traders.
Analyzes historical price data to identify patterns, support/resistance levels, and trend lines.
3. PAT Trends:
An auto-trending indicator based on price action and patterns, offering clarity on market trends and breakouts.
4. PAT Profile:
A powerful volume analysis tool aiding in technical analysis.
Analyzes traded volume at different price levels, identifying support and resistance, tracking market sentiment, and informing trading decisions.
5. PAT S/R:
Auto support and resistance analysis tool, eliminating the need for manual analysis.
Provides traders with key levels for making informed trading decisions.
6. PAT Auto FIB:
Automatically plots Fibonacci retracement levels on a price chart.
Simplifies the identification of potential support and resistance areas based on Fibonacci ratios.
7. PAT Blocks:
Represents significant buying or selling activity on a particular price level.
Identifies price rejections or consolidations, indicating potential imbalances between supply and demand.
8. PAT Zone:
Identifies key support and resistance zones on a price chart.
Indicates areas where buying and selling pressure is concentrated based on historical price action.
Skript nur auf Einladung
Ausschließlich Nutzer mit einer Erlaubnis des Autors können Zugriff auf dieses Script erhalten. Sie müssen diese Genehmigung bei dem Autor beantragen. Dies umfasst üblicherweise auch eine Zahlung. Wenn Sie mehr erfahren möchten, dann sehen Sie sich unten die Anweisungen des Autors an oder kontaktieren Sie PAT_CLUB direkt.
Es handelt sich hierbei um ein privates "Invite-Only" Script, welches nicht von unseren Script-Moderatoren geprüft wurde. Demzufolge wurde auch nicht ermittelt, ob es unseren Hausregeln entspricht. TradingView empfiehlt NICHT, für die Nutzung eines Scripts zu bezahlen, wenn Sie den Autor nicht als vertrauenswürdig halten und verstehen, wie das Script funktioniert. Sie können außerdem auch kostenlose Open-Source-Alternativen in unseren Community-Scripts finden.
Hinweise des Autors
Haftungsausschluss
Skript nur auf Einladung
Ausschließlich Nutzer mit einer Erlaubnis des Autors können Zugriff auf dieses Script erhalten. Sie müssen diese Genehmigung bei dem Autor beantragen. Dies umfasst üblicherweise auch eine Zahlung. Wenn Sie mehr erfahren möchten, dann sehen Sie sich unten die Anweisungen des Autors an oder kontaktieren Sie PAT_CLUB direkt.
Es handelt sich hierbei um ein privates "Invite-Only" Script, welches nicht von unseren Script-Moderatoren geprüft wurde. Demzufolge wurde auch nicht ermittelt, ob es unseren Hausregeln entspricht. TradingView empfiehlt NICHT, für die Nutzung eines Scripts zu bezahlen, wenn Sie den Autor nicht als vertrauenswürdig halten und verstehen, wie das Script funktioniert. Sie können außerdem auch kostenlose Open-Source-Alternativen in unseren Community-Scripts finden.