OPEN-SOURCE SCRIPT
Aktualisiert Show Daily Candles on Intraday Chart
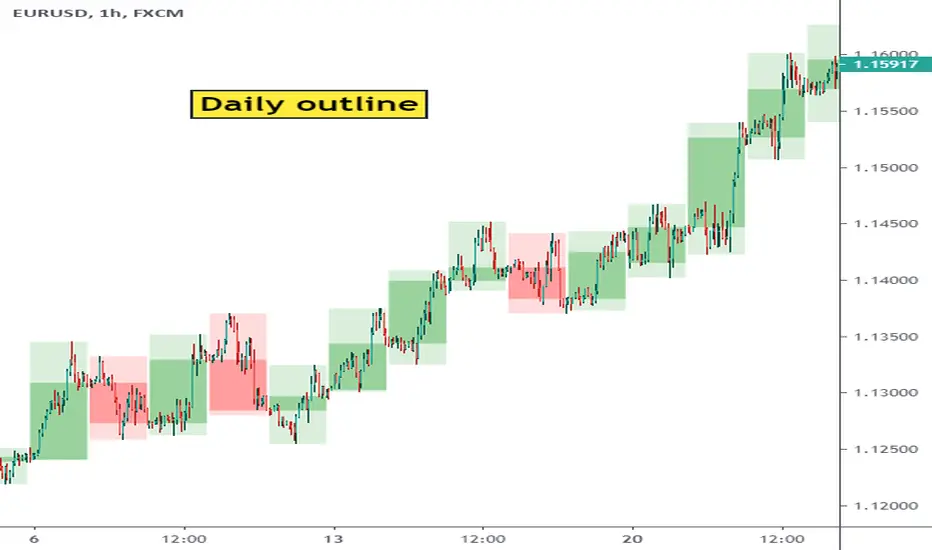
This script shows daily candle outlines on intraday periods. You can use this to simultaneously see what is happening on 'the bigger picture' without changing timeframe.
To address Tradingview moderation comments - this script only shows the outlines of completed days. So the most recent candle outline the indicator will show is yesterday.
I've not used the indicator in live trading yet so I don't know whether its going to be of useful to me yet but it was easy to code so I thought I'd give it a go. (Perhaps it will useful to people on the free tradingview subscription who have limited multi-chart options)
Versionshinweise
Does not function properly below 10 min periods so i deactivated it if you're on that timeframe. Pinescript does not seem to be able to look back more than 1000 bars so the script can not find where the day starts on the low timeframes...
Versionshinweise
other update had wrong image...Versionshinweise
You can now show Weekly and Monthly candles. Use the indicator options tabOpen-source Skript
Ganz im Sinne von TradingView hat dieser Autor sein/ihr Script als Open-Source veröffentlicht. Auf diese Weise können nun auch andere Trader das Script rezensieren und die Funktionalität überprüfen. Vielen Dank an den Autor! Sie können das Script kostenlos verwenden, aber eine Wiederveröffentlichung des Codes unterliegt unseren Hausregeln.
Haftungsausschluss
Die Informationen und Veröffentlichungen sind nicht als Finanz-, Anlage-, Handels- oder andere Arten von Ratschlägen oder Empfehlungen gedacht, die von TradingView bereitgestellt oder gebilligt werden, und stellen diese nicht dar. Lesen Sie mehr in den Nutzungsbedingungen.
Open-source Skript
Ganz im Sinne von TradingView hat dieser Autor sein/ihr Script als Open-Source veröffentlicht. Auf diese Weise können nun auch andere Trader das Script rezensieren und die Funktionalität überprüfen. Vielen Dank an den Autor! Sie können das Script kostenlos verwenden, aber eine Wiederveröffentlichung des Codes unterliegt unseren Hausregeln.
Haftungsausschluss
Die Informationen und Veröffentlichungen sind nicht als Finanz-, Anlage-, Handels- oder andere Arten von Ratschlägen oder Empfehlungen gedacht, die von TradingView bereitgestellt oder gebilligt werden, und stellen diese nicht dar. Lesen Sie mehr in den Nutzungsbedingungen.