PROTECTED SOURCE SCRIPT
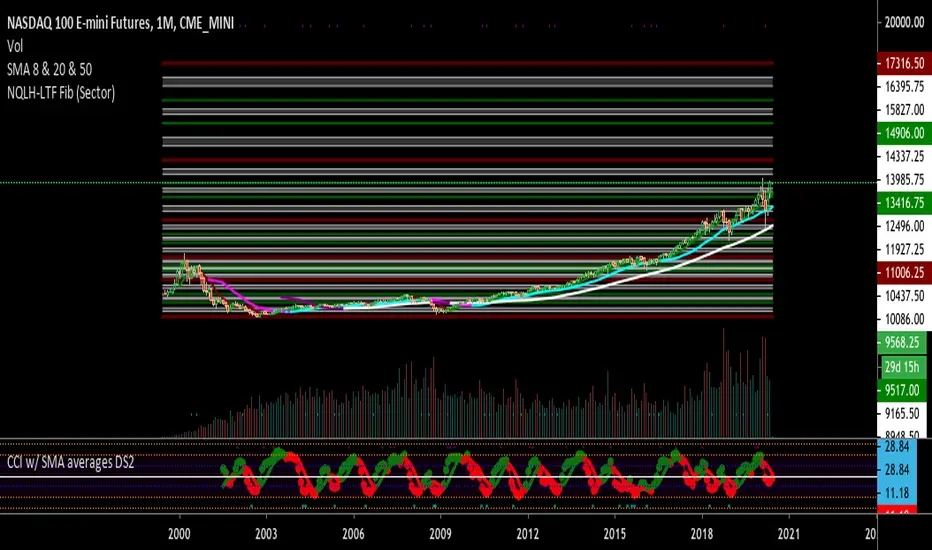
NQLH-LongerTimeFrame (LTF) - Maroon, Green, Black/White (NQLH)

This is a Longerer Time Frame Fib level indicator. It shows where the NQ market is looking to go and where it has been. When the market gets above one level ( white bar, for example) look for price action to continue to the next level. If it breaks below the white bar look for it to go the next level below for support. It is great for having targets. It helps in knowing why the market may continue in a direction. For example: When the price action has already moved up, why does it keep going up, because it hasn't reached targeted fib level yet. Same reason price action may move lower. It is looking for its fib level support. You can find them yourself by taking the red level fibs as plug numbers. This makes it fractal in nature. Find the fractal or/of inner fibs by plugging in two consecutive red level fib numbers as the plug numbers. With two plug number it will work for any instrument at any level. Use this indicator for a daily or weekly chart. The close on the day or the week would indicate where the next target level is at.
Geschütztes Skript
Dieses Skript wird als Closed-Source veröffentlicht und Sie können es frei verwenden. Sie können es favorisieren, um es auf dem Chart zu verwenden. Sie können den Quellcode nicht einsehen oder verändern.
Möchten Sie dieses Skript auf einem Chart verwenden?
Haftungsausschluss
Die Informationen und Veröffentlichungen sind nicht als Finanz-, Anlage-, Handels- oder andere Arten von Ratschlägen oder Empfehlungen gedacht, die von TradingView bereitgestellt oder gebilligt werden, und stellen diese nicht dar. Lesen Sie mehr in den Nutzungsbedingungen.