OPEN-SOURCE SCRIPT
Madrid Trend Trading
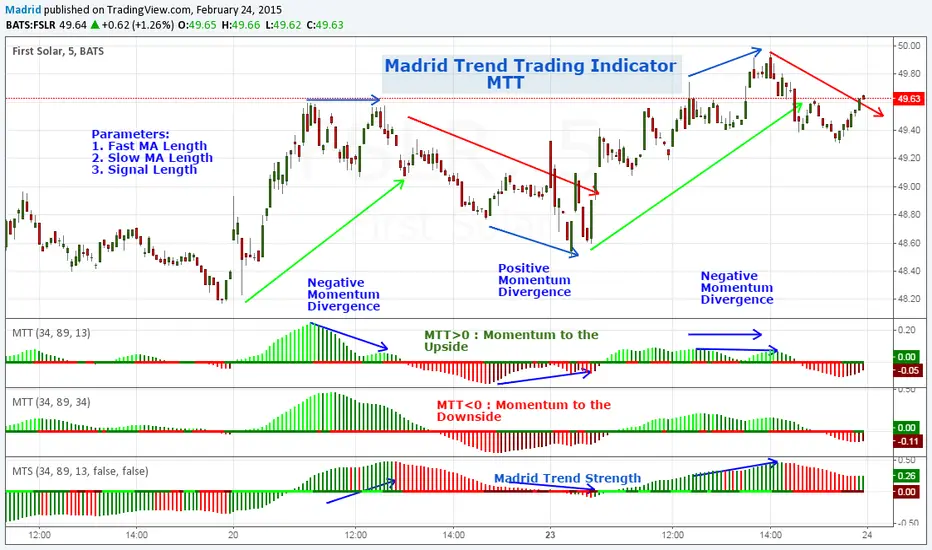
Madrid Trend Trading is an indicator that shows Momentum direction and strength based on a given trend (pair of MA's). It is useful to detect the direction of the trend, Momentum divergences with the trend and possible trend reversals.
Parameters
1. Fast MA Length
2. Slow MA Length
3. Signal Length
Trading with MTT
1. MTT > 0 and increasing (Lime) : Long position
2. MTT > 0 and decreasing (Green) : entry/exit long position, take profits or plan an entry
3. MTT < 0 and decreasing (Red) : Short position
4. MTT <0 and increasing (Maroon) : entry/exit short position, take profits or plan entry
This shows the market waves, it's a good indicator for swing trading since it shows the change of direction of the trend, signals profit areas and entry/exit regions. Change in the direction of the trend can be spotted by the cross over the zero line or by trend divergences, H-H in the trend and L-H in the MTT indicator means a downtrend is close. L-L in the trend and H-L in the indicator means an uptrend is forming.
There is a bar in the zero line that shows the momentum direction, simple, green it's increasing, red, it's decreasing.
This indicator is meant to be a companion of the MTS indicator. When combined MTS shows the direction and strength of the trend, meanwhile MTT shows if the trend is weakening, gaining strength, confirms continuation or warns a reversal.
What I look from my indicators is to create a tool that filters out as much noise as possible without losing much sensitivity, they have to be easy to tune and simple to analyze, so I normally use contrasting colors, using cold colors for long positions and warm colors for short positions. I try to use the least possible number of parameters and the defaults have been set after several months of testing in Beta mode against hundreds of charts before publishing them.
I hope this effort can help you to have a simpler point of view of the market.
Open-source Skript
Ganz im Sinne von TradingView hat dieser Autor sein/ihr Script als Open-Source veröffentlicht. Auf diese Weise können nun auch andere Trader das Script rezensieren und die Funktionalität überprüfen. Vielen Dank an den Autor! Sie können das Script kostenlos verwenden, aber eine Wiederveröffentlichung des Codes unterliegt unseren Hausregeln.
Haftungsausschluss
Die Informationen und Veröffentlichungen sind nicht als Finanz-, Anlage-, Handels- oder andere Arten von Ratschlägen oder Empfehlungen gedacht, die von TradingView bereitgestellt oder gebilligt werden, und stellen diese nicht dar. Lesen Sie mehr in den Nutzungsbedingungen.