PROTECTED SOURCE SCRIPT
[Vold] Trading Strategy

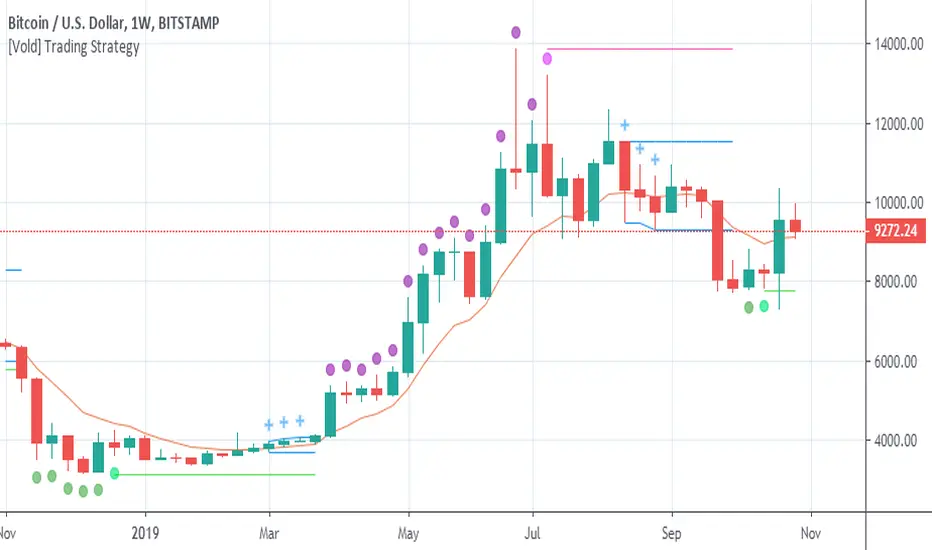
Green dot = Trending down.
Purple dot = Trending up.
Fuchsia dot = Uptrend ended.
Lime dot = Downtrend ended.
Fuchsia line = The highest value of the last trend (breaking it up means continuation.
Lime line = Idem fuchsia line but to the downside.
Blue crosses = Could be different things: 1. A dip to buy, 2. A rally to sell, 3. Building a range ...
Blue range = Depending on the direction it breaks, is the next direction.
Golden line = Candles above favour uptrends, Candles below favour downtrends, also works as support and resistance .
This trading strategy can be traded very mechanically (see this experiment here: tradingview.com/chart/BTCUSD...)
But I don't advice to do that, use it along with other indicators to make better decisions ( RSI for example) or volume of the trends and the end of them. Also, you can use higher timeframes to understand better the context.
Geschütztes Skript
Dieses Script ist als Closed-Source veröffentlicht. Sie können es kostenlos und ohne Einschränkungen verwenden – erfahren Sie hier mehr.
Haftungsausschluss
Die Informationen und Veröffentlichungen sind nicht als Finanz-, Anlage-, Handels- oder andere Arten von Ratschlägen oder Empfehlungen gedacht, die von TradingView bereitgestellt oder gebilligt werden, und stellen diese nicht dar. Lesen Sie mehr in den Nutzungsbedingungen.