PROTECTED SOURCE SCRIPT
MarsMine_Over
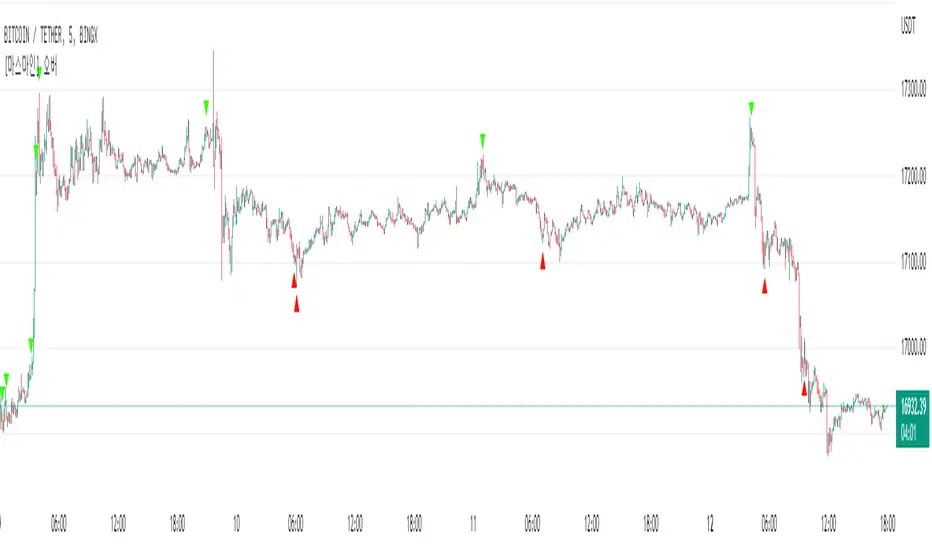
This indicator marks the area where the overbought/oversold section of the Stochastic RSI and the overbought/oversold section of the RSI overlap with arrows.
If an upward arrow appears on the indicator, it can be recognized that both StoRSI and RSI have entered the oversold zone.
When a down arrow appears, both the StoRSI and RSI can be considered to have entered the overbought zone.
This is a good signal to identify the direction of the future trend.
이 지표는 Stochastic RSI의 과매수/과매도 구간과 RSI의 과매수/과매도 구간이 겹치는 구간을 화살표로 표기 해주는 지표 입니다.
해당 지표에서 상승 화살표가 출현할 경우에는 StoRSI와 RSI 모두 과매도 구간에 진입했다고 인식할 수 있으며,
하락 화살표가 출현할 경우에는 StoRSI와 RSI 모두 과매수 구간에 진입했다고 인식할 수 있습니다.
이는 추후 추세의 방향성을 파악할 수 있는 좋은 시그널 입니다.
Geschütztes Skript
Dieses Script ist als Closed-Source veröffentlicht. Sie können es kostenlos und ohne Einschränkungen verwenden – erfahren Sie hier mehr.
Haftungsausschluss
Die Informationen und Veröffentlichungen sind nicht als Finanz-, Anlage-, Handels- oder andere Arten von Ratschlägen oder Empfehlungen gedacht, die von TradingView bereitgestellt oder gebilligt werden, und stellen diese nicht dar. Lesen Sie mehr in den Nutzungsbedingungen.