PROTECTED SOURCE SCRIPT
Dynamic Probability Bands (Historical Bands)
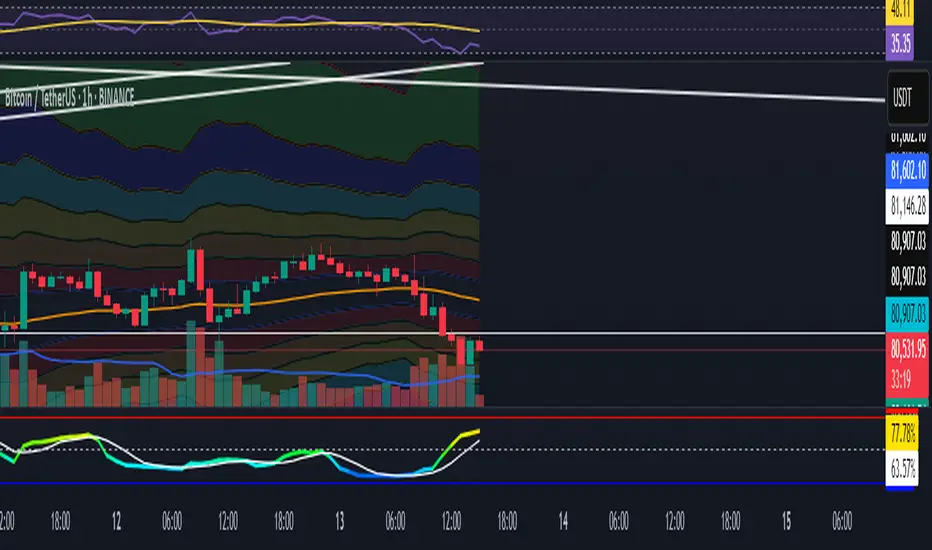
Dynamic Probability Bands (Blended/Original Modes)
This indicator displays dynamic probability bands that estimate the likelihood (on a 0–100 scale) for a stock to move within certain price zones relative to a dynamically calculated center. It combines state‐of‐the‐art volatility scaling with customizable center calculation methods, allowing traders to analyze both current and historical price probability levels.
Key Features:
Dual Center Modes:
Original Mode: Uses either an EMA or yesterday’s pivot (average of high, low, and close) as the center.
Blended Mode: Inspired by HPDR Bands, it calculates the center by blending a long-term “visible” range (expanded by custom multipliers) with recent price extremes. This blending makes the center both robust and responsive.
Volatility Scaling with Exponential Factor: The script measures volatility using ATR and expands the forecast range over a user-defined number of bars. An exponent factor lets you adjust the dynamic expansion—from the familiar square-root behavior (with a factor of 0.5) to more aggressive widening.
Probability Levels via Inverse Normal Function: Custom inverse error and inverse-normal functions convert cumulative probability inputs (ranging from near 0% to almost 100%) into z-scores. The resulting band levels are computed as: Band Level = Center + (Scaled Volatility × z-score) Separate series are generated for upward (above the center) and downward (below the center) bands.
Historical Analysis & Visualization: The bands are plotted as continuous series, with fill colors between adjacent bands for clear visual separation. This lets you analyze how the probability zones have evolved over time.
Fully Customizable: Users can adjust key parameters including the choice of center method, lookback periods, multipliers, forecast horizon, and expansion dynamics to suit various markets and strategies.
Use This Indicator To:
Assess potential future price zones based on statistical probability.
Monitor the dynamic evolution of price ranges as market conditions change.
Customize your analysis through blended or traditional center calculations and variable volatility scaling.
Geschütztes Skript
Dieses Script ist als Closed-Source veröffentlicht. Sie können es kostenlos und ohne Einschränkungen verwenden – erfahren Sie hier mehr.
Haftungsausschluss
Die Informationen und Veröffentlichungen sind nicht als Finanz-, Anlage-, Handels- oder andere Arten von Ratschlägen oder Empfehlungen gedacht, die von TradingView bereitgestellt oder gebilligt werden, und stellen diese nicht dar. Lesen Sie mehr in den Nutzungsbedingungen.