PROTECTED SOURCE SCRIPT
alsubihi.2
Advanced Market Structure Indicator
This custom-built indicator provides an in-depth analysis of market structure changes to help traders identify key price levels, trends, and potential reversals. It combines multiple tools to give you a clearer picture of market behavior and improve your decision-making process.
Key Features:
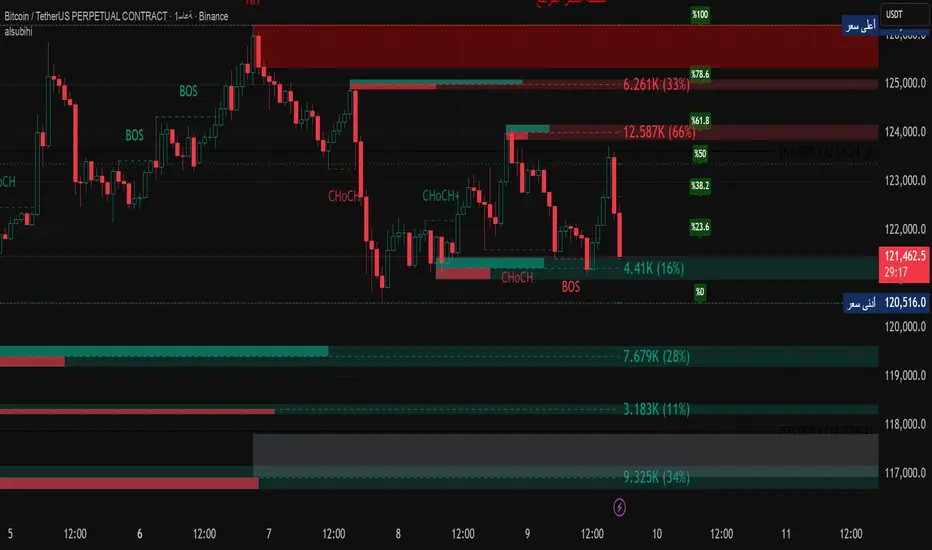
Break of Structure (BOS):
The BOS indicator identifies significant changes in market structure, marking when the price breaks previous highs or lows, signaling a potential trend shift. Green lines represent upward breaks (bullish trend), while red lines show downward breaks (bearish trend).
Change of Character (Choch):
This feature helps to highlight subtle shifts in market dynamics. A change in character (Choch) indicates when the market transitions between bullish or bearish behavior. Green indicates a bullish character change, while red shows a bearish one.
Premium vs Discount Zones:
The indicator identifies price levels that are considered 'Premium' (high price levels) and 'Discount' (low price levels), assisting traders in recognizing overbought or oversold conditions and making better trading decisions based on market conditions.
Support and Resistance Levels:
Automatically drawn support and resistance lines are included to show critical price areas where reversals or breakouts might occur, helping traders anticipate price action.
Equilibrium Zone:
This is the price level where supply and demand balance out, acting as a key reference point for identifying potential market reversals or continuation.
Why Use This Indicator?
This all-in-one tool helps traders make informed decisions by combining multiple technical analysis concepts into a single, easy-to-use indicator. It reduces the complexity of analyzing price action and allows traders to quickly identify potential entry and exit points with greater accuracy.
Whether you are an experienced trader or just starting, this indicator provides you with the essential tools needed to identify trend shifts, key support and resistance zones, and price extremes, leading to more profitable trading decisions.
14 سبتمبر
ملاحظات الأخبار
📌 Summary of the Indicator
Market Structure (MS):
Detects swing & internal BOS, CHoCH, CHoCH+. Can color candles or bars by trend.
Multi-Timeframe Scanner (MTF):
Shows trend direction on multiple TFs (5m → 1W).
Highs/Lows (HTF):
Plots previous Day/Week/Month/Year highs & lows as liquidity levels.
Order Blocks (OB):
Draws volumetric order blocks, with filters (BOS/CHoCH), overlap rules, mitigation, and volume metrics.
Fair Value Gaps (FVG/VI/OG):
Detects price imbalances, extends them, and removes when mitigated.
Accumulation/Distribution Zones:
Highlights Wyckoff-style accumulation (green) or distribution (red).
Equal Highs/Lows (EQH/EQL):
Marks liquidity pools at equal highs or lows.
Premium/Discount Bands:
Splits swing range into premium, equilibrium, and discount zones.
RSI & ADX:
Momentum filters for overbought/oversold and trend strength.
DEMA-ATR Baseline:
Adaptive EMA with ATR constraints; alerts for trend shifts.
Regression Channel:
Auto-fits best regression length using Pearson-R, shows channel with std bands.
Fibonacci Ladder:
Auto plots levels 0.236 → 1.618 based on recent swing.
👉 In short: it’s a full SMC toolkit — structure + liquidity + OB/FVG + momentum filters + extra tools (fib, regression, ATR baseline).
📌 ملخص المؤشر
البنية الهيكلية (Market Structure):
يحدد BOS و CHoCH داخلي وسوينغ، ويقدر يلوّن الشموع حسب الاتجاه.
سكانر متعدد الأطر (MTF):
يعرض الاتجاه على عدة فريمات من 5m إلى 1W.
هاي/لو من أطر عليا (HTF Highs/Lows):
يرسم قمم وقيعان اليوم/الأسبوع/الشهر/السنة السابقة (مناطق سيولة).
بلوكات الطلب/العرض (Order Blocks):
يرسم بلوكات مع فلاتر (BOS/CHoCH)، خيارات تداخل، إزالة عند الكسر، ويعرض حجم التداول بداخلها.
الفجوات السعرية (FVG/VI/OG):
يحدد الفجوات غير المغطاة، يمددها، ويحذفها عند التغطية.
مناطق التجميع/التوزيع:
يوضح مناطق Wyckoff (أخضر للتجميع، أحمر للتوزيع).
قمم وقيعان متساوية (EQH/EQL):
يميز مناطق السيولة فوق القمم أو تحت القيعان المتساوية.
مناطق Premium/Discount/Equilibrium:
يقسم آخر نطاق إلى مناطق غالية (Premium)، توازن (Equilibrium)، ورخيصة (Discount).
RSI و ADX:
مؤشرات إضافية لقياس التشبع وقوة الاتجاه.
خط DEMA-ATR:
EMA متكيف مع قيود ATR، يتغير لونه حسب الاتجاه، مع تنبيهات جاهزة.
قناة الانحدار (Regression):
تختار أفضل طول باستخدام معامل الارتباط Pearson-R، وترسم قناة مع انحراف معياري.
فيبوناتشي (Fibonacci):
يرسم مستويات 0.236 حتى 1.618 حسب آخر حركة سعرية.
👉 باختصار: المؤشر هو أداة SMC متكاملة تجمع الهيكل، السيولة، البلوكات، الفجوات، والمؤشرات المساعدة.
This custom-built indicator provides an in-depth analysis of market structure changes to help traders identify key price levels, trends, and potential reversals. It combines multiple tools to give you a clearer picture of market behavior and improve your decision-making process.
Key Features:
Break of Structure (BOS):
The BOS indicator identifies significant changes in market structure, marking when the price breaks previous highs or lows, signaling a potential trend shift. Green lines represent upward breaks (bullish trend), while red lines show downward breaks (bearish trend).
Change of Character (Choch):
This feature helps to highlight subtle shifts in market dynamics. A change in character (Choch) indicates when the market transitions between bullish or bearish behavior. Green indicates a bullish character change, while red shows a bearish one.
Premium vs Discount Zones:
The indicator identifies price levels that are considered 'Premium' (high price levels) and 'Discount' (low price levels), assisting traders in recognizing overbought or oversold conditions and making better trading decisions based on market conditions.
Support and Resistance Levels:
Automatically drawn support and resistance lines are included to show critical price areas where reversals or breakouts might occur, helping traders anticipate price action.
Equilibrium Zone:
This is the price level where supply and demand balance out, acting as a key reference point for identifying potential market reversals or continuation.
Why Use This Indicator?
This all-in-one tool helps traders make informed decisions by combining multiple technical analysis concepts into a single, easy-to-use indicator. It reduces the complexity of analyzing price action and allows traders to quickly identify potential entry and exit points with greater accuracy.
Whether you are an experienced trader or just starting, this indicator provides you with the essential tools needed to identify trend shifts, key support and resistance zones, and price extremes, leading to more profitable trading decisions.
14 سبتمبر
ملاحظات الأخبار
📌 Summary of the Indicator
Market Structure (MS):
Detects swing & internal BOS, CHoCH, CHoCH+. Can color candles or bars by trend.
Multi-Timeframe Scanner (MTF):
Shows trend direction on multiple TFs (5m → 1W).
Highs/Lows (HTF):
Plots previous Day/Week/Month/Year highs & lows as liquidity levels.
Order Blocks (OB):
Draws volumetric order blocks, with filters (BOS/CHoCH), overlap rules, mitigation, and volume metrics.
Fair Value Gaps (FVG/VI/OG):
Detects price imbalances, extends them, and removes when mitigated.
Accumulation/Distribution Zones:
Highlights Wyckoff-style accumulation (green) or distribution (red).
Equal Highs/Lows (EQH/EQL):
Marks liquidity pools at equal highs or lows.
Premium/Discount Bands:
Splits swing range into premium, equilibrium, and discount zones.
RSI & ADX:
Momentum filters for overbought/oversold and trend strength.
DEMA-ATR Baseline:
Adaptive EMA with ATR constraints; alerts for trend shifts.
Regression Channel:
Auto-fits best regression length using Pearson-R, shows channel with std bands.
Fibonacci Ladder:
Auto plots levels 0.236 → 1.618 based on recent swing.
👉 In short: it’s a full SMC toolkit — structure + liquidity + OB/FVG + momentum filters + extra tools (fib, regression, ATR baseline).
📌 ملخص المؤشر
البنية الهيكلية (Market Structure):
يحدد BOS و CHoCH داخلي وسوينغ، ويقدر يلوّن الشموع حسب الاتجاه.
سكانر متعدد الأطر (MTF):
يعرض الاتجاه على عدة فريمات من 5m إلى 1W.
هاي/لو من أطر عليا (HTF Highs/Lows):
يرسم قمم وقيعان اليوم/الأسبوع/الشهر/السنة السابقة (مناطق سيولة).
بلوكات الطلب/العرض (Order Blocks):
يرسم بلوكات مع فلاتر (BOS/CHoCH)، خيارات تداخل، إزالة عند الكسر، ويعرض حجم التداول بداخلها.
الفجوات السعرية (FVG/VI/OG):
يحدد الفجوات غير المغطاة، يمددها، ويحذفها عند التغطية.
مناطق التجميع/التوزيع:
يوضح مناطق Wyckoff (أخضر للتجميع، أحمر للتوزيع).
قمم وقيعان متساوية (EQH/EQL):
يميز مناطق السيولة فوق القمم أو تحت القيعان المتساوية.
مناطق Premium/Discount/Equilibrium:
يقسم آخر نطاق إلى مناطق غالية (Premium)، توازن (Equilibrium)، ورخيصة (Discount).
RSI و ADX:
مؤشرات إضافية لقياس التشبع وقوة الاتجاه.
خط DEMA-ATR:
EMA متكيف مع قيود ATR، يتغير لونه حسب الاتجاه، مع تنبيهات جاهزة.
قناة الانحدار (Regression):
تختار أفضل طول باستخدام معامل الارتباط Pearson-R، وترسم قناة مع انحراف معياري.
فيبوناتشي (Fibonacci):
يرسم مستويات 0.236 حتى 1.618 حسب آخر حركة سعرية.
👉 باختصار: المؤشر هو أداة SMC متكاملة تجمع الهيكل، السيولة، البلوكات، الفجوات، والمؤشرات المساعدة.
Geschütztes Skript
Dieses Script ist als Closed-Source veröffentlicht. Sie können es kostenlos und ohne Einschränkungen verwenden – erfahren Sie hier mehr.
Haftungsausschluss
Die Informationen und Veröffentlichungen sind nicht als Finanz-, Anlage-, Handels- oder andere Arten von Ratschlägen oder Empfehlungen gedacht, die von TradingView bereitgestellt oder gebilligt werden, und stellen diese nicht dar. Lesen Sie mehr in den Nutzungsbedingungen.