Curvature Tensor Pivots
Curvature Tensor Pivots: Geometric Pivot Detection Through Differential Geometry
Curvature Tensor Pivots applies mathematical differential geometry to market price analysis, identifying pivots by measuring how price trajectories bend through space. Unlike traditional pivot indicators that rely solely on price highs and lows, this system calculates the actual geometric curvature of price paths and detects inflection points where the curvature changes sign or magnitude—the mathematical hallmarks of directional transitions.
The indicator combines three components: precise curvature measurement using second-derivative calculus, tensor weighting that multiplies curvature by volatility and momentum, and a tension-based prediction system that identifies compression before pivots form. This creates a forward-looking pivot detector with built-in confirmation mechanics.
What Makes This Original
Pure Mathematical Foundation
This indicator implements the classical differential geometry curvature formula κ = |y''| / (1 + y'²)^(3/2), which measures how sharply a curve bends at any given point. In price analysis, high curvature indicates sharp directional changes (active pivots), while curvature approaching zero indicates straight-line motion (inflection points forming). This mathematical approach is fundamentally different from pattern recognition or statistical pivots—it measures the actual geometry of price movement.
Tensor Weighting System
The core innovation is the tensor scoring mechanism, which multiplies geometric curvature by two market-state variables: volatility (ATR expansion/compression) and momentum (rate of change strength). This creates a multi-dimensional strength metric that distinguishes between meaningful pivots and noise. A high tensor score means high curvature is occurring during significant volatility with strong momentum—a genuine structural turning point. Low tensor scores during high curvature indicate choppy, low-conviction moves.
Tension-Based Prediction
The system calculates tension as the inverse of curvature (Tension = 1 - κ). When curvature is low, tension is high, indicating price is moving in a straight line and approaching an inflection point where it must curve. The tension cloud visualizes this compression, tightening before pivots form and expanding after they complete. This provides anticipatory signals rather than purely reactive confirmation.
Integrated Confirmation Architecture
Rather than simply flagging high curvature, the system requires convergence of four elements: geometric inflection detection (sign changes in second derivative or curvature extrema), traditional price structure pivots (pivot highs/lows), tensor strength above threshold, and minimum spacing between signals. This multi-layer confirmation prevents false signals while maintaining sensitivity to genuine turning points.
This is not a combination of existing indicators—it's an application of pure mathematical concepts (differential calculus and tensor algebra) to market geometry, creating a unique analytical framework.
Core Components and How They Work Together
1. Differential Geometry Engine
The foundation is calculus-based trajectory analysis. The system treats price as a function y(t) and calculates:
First derivative (y'): The slope of the price trajectory, representing directional velocity
Second derivative (y''): The acceleration of slope change, representing how quickly direction is shifting
Curvature (κ): The normalized geometric bend, calculated using the formula κ = |y''| / (1 + y'²)^(3/2)
This curvature value is then normalized to a 0-1 range using adaptive statistical bounds (mean ± 2 standard deviations over a rolling window). High κ values indicate sharp bends (active pivots), while κ approaching zero indicates inflection points where the trajectory is straightening before changing concavity.
2. Tensor Weighting Components
The raw curvature is weighted by market dynamics to create the tensor score:
Volatility Component: Calculated as current ATR divided by baseline ATR (smoothed average). Values above 1.0 indicate expansion (higher conviction moves), while values below 1.0 indicate compression (lower reliability). This ensures pivots forming during volatile periods receive higher scores than those in quiet conditions.
Momentum Component: Measured using rate of change (ROC) strength normalized by recent average. High momentum indicates sustained directional pressure, confirming that curvature changes represent genuine trend shifts rather than noise.
Tensor Score Fusion: The final tensor score = κ × Volatility × Momentum × Direction × Gain. This creates a directional strength metric ranging from -1 (strong bearish curvature) to +1 (strong bullish curvature). The magnitude represents conviction, while the sign represents direction.
These components work together by filtering geometric signals through market-state context. A high curvature reading during low volatility and weak momentum produces a low tensor score (likely noise), while the same curvature during expansion and strong momentum produces a high tensor score (likely genuine pivot).
3. Inflection Point Detection System
Inflection points occur where the second derivative changes sign (concave to convex or vice versa) or where curvature reaches local extrema. The system detects these through multiple methods:
Sign change detection: When y'' crosses zero, the price trajectory is transitioning from curving upward to downward (or vice versa)
Curvature extrema: When κ reaches a local maximum or minimum, indicating peak bend intensity
Near-zero curvature: When κ falls below an adaptive threshold, indicating straight-line motion before a directional change
These geometric signals are combined with traditional pivot detection (pivot highs and lows using configurable lookback/lookahead periods) to create confirmed inflection zones. The geometric math identifies WHERE inflections are forming, while price structure confirms WHEN they've completed.
4. Tension Cloud Prediction
Tension is calculated as 1 - κ, creating an inverse relationship where low curvature produces high tension. This represents the "straightness" of price trajectory—when price moves in a straight line, it's building tension that must eventually release through a curved pivot.
The tension cloud width adapts to this tension value: it tightens (narrows) when curvature is low and tension is high, providing visual warning that a pivot is forming. After the pivot completes and curvature increases, tension drops and the cloud expands, confirming the turn.
This creates a leading indicator component within the system: watch for the cloud to compress, then wait for the pivot marker and tensor direction confirmation to enter trades.
5. Multi-Layer Visualization System
The visual components work hierarchically:
Curvature ribbons (foundation): Width expands with curvature magnitude, color shifts with tensor direction (green bullish, red bearish)
Tension cloud (prediction): Purple overlay that compresses before pivots and expands after
Tensor waves (context): Harmonic oscillating layers driven by three phase accumulators (curvature, tensor magnitude, volatility), creating visual texture that becomes erratic before pivots and smooth during trends
Inflection zones (timing): Golden background highlighting when geometric conditions indicate inflection points forming
Pivot markers (confirmation): Triangles marking confirmed pivots where geometric inflection + price structure + tensor strength all align
Each layer adds information without redundancy: ribbons show current state, tension shows prediction, waves show regime character, zones show geometric timing, and markers show confirmed entries.
Calculation Methodology
Phase 1 - Derivative Calculations
Price is normalized by dividing by a 50-period moving average to improve numerical stability. The first derivative is calculated as the bar-to-bar change, then smoothed using a configurable smoothing length (default 3 bars) to reduce noise while preserving structure.
The second derivative is calculated as the bar-to-bar change in the first derivative, also smoothed. This represents the acceleration of directional change—positive values indicate price is curving upward (concave up), negative values indicate curving downward (concave down).
Phase 2 - Curvature Formula
The classical curvature formula is applied:
Calculate y'² (first derivative squared)
Calculate (1 + y'²)^1.5 as the denominator
Divide |y''| by this denominator to get raw curvature κ
This formula ensures curvature is properly normalized regardless of the steepness of the trajectory. A vertical line with high slope (large y') can still have low curvature (straight), while a gradual slope with changing direction produces high curvature (curved).
The raw curvature is then normalized to 0-1 range using adaptive bounds (rolling mean ± 2 standard deviations), allowing the system to adapt to different market volatility regimes.
Phase 3 - Tensor Weighting
ATR is calculated over the specified volatility length (default 14). Current ATR is divided by smoothed ATR to create the volatility ratio. Momentum is calculated as the rate of change over the momentum length (default 10), normalized by recent average ROC.
The tensor score is computed as: Curvature × Volatility × Momentum × Tensor Gain × Direction Sign
This creates the final directional strength metric used for ribbon coloring and signal generation.
Phase 4 - Inflection Detection
Multiple conditions are evaluated simultaneously:
Second derivative sign changes (y''[current] × y''[previous] < 0)
Curvature local maxima (previous bar κ > current bar κ AND previous bar κ > two bars ago κ)
Curvature local minima (opposite condition)
Low curvature threshold (current κ < adaptive threshold)
Any of these conditions triggers inflection zone highlighting. For confirmed pivot signals, inflection detection must coincide with traditional pivot highs/lows AND tensor magnitude must exceed threshold AND minimum spacing since last signal must be satisfied.
Phase 5 - Tension Calculation
Tension = 1 - κ (smoothed)
This inverse relationship creates the compression/expansion dynamic. When curvature approaches zero (straight trajectory), tension approaches 1 (maximum compression). When curvature is high (sharp bend), tension approaches zero (released).
The tension cloud bands are calculated as: Basis ± (Ribbon Width × Tension)
This creates the visual tightening effect before pivots.
Phase 6 - Wave Generation
Three phase accumulators are maintained:
Phase 1: Accumulates based on curvature magnitude (0.1 × κ per bar)
Phase 2: Accumulates based on tensor magnitude (0.15 × tensor per bar)
Phase 3: Accumulates based on volatility (0.08 × volatility per bar)
For each wave layer (2-8 configurable), a unique frequency is used (layer number × 0.6). The wave offset is calculated as:
Amplitude × (sin(phase1 × frequency) × 0.4 + sin(phase2 × frequency × 1.2) × 0.35 + sin(phase3 × frequency × 0.8) × 0.25)
This creates complex harmonic motion that reflects the interplay of curvature, strength, and volatility. When these components are aligned, waves are smooth; when misaligned (pre-pivot conditions), waves become chaotic.
All calculations are deterministic and execute on closed bars only—there is no repainting.
How to Use This Indicator
Setup and Configuration
Apply the indicator to your chart with default settings initially
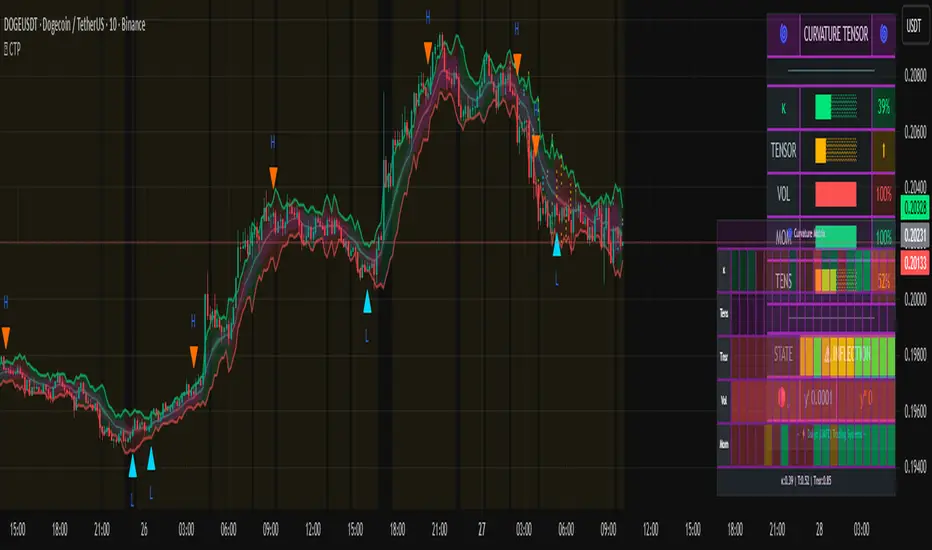
Enable the main dashboard (top right recommended) to monitor curvature, tensor, and tension metrics in real-time
Enable the curvature matrix (bottom right) to see historical patterns in the heatmap
Choose your ribbon mode: "Dual Ribbon" shows both bullish and bearish zones, "Tension Cloud" emphasizes the compression zones
For your first session, observe how the tension cloud behaves before confirmed pivots—you'll notice it consistently tightens (narrows) before pivot markers appear, then expands after.
Signal Interpretation
High Pivot (Bearish) - Red triangle above price:
Occurs when price makes a pivot high (local maximum)
Second derivative is negative (concave down curvature)
Tensor magnitude exceeds threshold (strong confirmation)
Minimum spacing requirement met (noise filter)
Interpretation: A confirmed bearish inflection point has formed. Price trajectory has curved over and is transitioning from upward to downward movement.
Low Pivot (Bullish) - Blue triangle below price:
Occurs when price makes a pivot low (local minimum)
Second derivative is positive (concave up curvature)
Tensor magnitude exceeds threshold
Spacing requirement met
Interpretation: A confirmed bullish inflection point has formed. Price trajectory has curved upward and is transitioning from downward to upward movement.
Dashboard Metrics
κ (Curvature): 0-100% reading. Above 70% = sharp active pivot, 40-70% = moderate curve, below 40% = gentle or approaching inflection
Tensor: Directional strength. Arrow indicates bias (⬆ bullish, ⬇ bearish, ⬌ neutral). Magnitude indicates conviction.
Volatility: Current ATR expansion state. Above 70% = high volatility (pivots more significant), below 40% = compressed (pivots less reliable)
Momentum: Directional strength. High values confirm trend continuation, low values suggest exhaustion
Tension: 0-100% reading. Above 70% = pivot forming soon (high compression), below 40% = pivot recently completed (expanded)
State: Real-time regime classification:
"🟢 STABLE" = normal trending conditions
"🟡 TENSION" = pivot forming (high compression)
"🔴 HIGH κ" = active sharp pivot in progress
"⚠ INFLECTION" = geometric inflection zone (critical transition)
Curvature Matrix Heatmap
The matrix shows the last 30 bars (configurable 10-100) of historical data across five metrics:
κ row: Curvature evolution (green = low, yellow = moderate, red = high)
Tension row: Purple intensity shows compression building
Tensor row: Strength evolution (green = strong, yellow = moderate, red = weak)
Volatility row: Expansion state
Momentum row: Directional conviction
Pattern recognition: Look for purple clustering in the tension row followed by red spikes in the κ row—this shows compression → release pivot sequence.
Trading Workflow
Step 1 - Monitor Tension:
Watch the tension cloud and dashboard tension metric. When tension rises above 60-70% and the cloud visibly tightens, a pivot is building. The matrix will show purple bands clustering.
Step 2 - Identify Inflection Zone:
Wait for the golden background glow (inflection zone) to appear. This indicates the geometric conditions are met: curvature is approaching zero, second derivative is near sign change, or curvature extrema detected. The dashboard state will show "⚠ INFLECTION ZONE".
Step 3 - Confirm Direction:
Check the tensor arrow in the dashboard:
⬆ (bullish tensor) = expect bullish pivot
⬇ (bearish tensor) = expect bearish pivot
Also verify the y'' status in the dashboard:
"🔵↑ Concave Up" = bullish curvature forming
"🔴↓ Concave Down" = bearish curvature forming
Step 4 - Wait for Pivot Marker:
Do not enter on inflection zones alone—wait for the confirmed pivot marker (triangle). This ensures all confirmation layers have aligned: geometric inflection + price structure pivot + tensor strength + spacing filter.
Step 5 - Execute Entry:
Long entry: Blue triangle below price + ⬆ tensor + tension releasing (dropping)
Short entry: Red triangle above price + ⬇ tensor + tension releasing
Step 6 - Manage Risk:
Initial stop: Place beyond the opposite ribbon edge plus one ATR buffer
Trailing stop: Follow the ribbon edge (basis ± adaptive width) as curvature sustains in your direction
Exit signal: If tension spikes again quickly (another inflection forming), consider taking profit—the trend may be reversing
Best Practices
Use multiple timeframe confirmation: Check that higher timeframe tensor aligns with your trade direction
Respect the spacing filter: If a pivot just fired, wait for minimum spacing before taking another signal
Distinguish regime: In "🔴 HIGH κ" state (choppy), reduce position size; in "🟢 STABLE" state, full confidence
Combine with support/resistance: Pivots near key levels have higher probability
Watch particle density: Clustering of particles indicates rising curvature intensity
Observe wave texture: Smooth flowing waves = trending environment (pivots are reversals); chaotic erratic waves = reversal environment (pivots are trend starts)
Ideal Market Conditions
Best Performance
Liquid markets with clear swing structure (forex majors, large-cap stocks, major indices)
Timeframes from 15-minute to daily (the system adapts across timeframes)
Markets with periodic swings and clear directional phases (where geometric curvature is meaningful)
Trending markets with consolidation phases (where tension builds before breakouts)
Challenging Conditions
Extremely choppy/sideways markets for extended periods (high curvature but low tensor magnitude—system will reduce signals appropriately)
Very low liquidity instruments (erratic price action creates false geometric signals)
Ultra-low timeframes (1-minute or below) where spread and noise dominate structure
Markets in deep consolidation (the system will show high tension but no clean pivot confirmation)
The indicator is designed to adapt: in poor conditions, tensor scores remain low and signals reduce naturally. In optimal conditions, tension compression → inflection → pivot confirmation sequences occur cleanly.
Parameter Optimization by Trading Style
Scalping (5-15 Minute Charts)
Curvature Window: 3-5 (faster response)
Curvature Smoothing: 2 (minimal lag)
Volatility Length: 10-14
Momentum Length: 8-10
Tensor Gain: 1.2-1.5 (moderate sensitivity)
Inflection Threshold: 0.10-0.15 (more sensitive)
Min Pivot Spacing: 3-5 bars
Pivot Mode: Aggressive
Ribbon Mode: Dual Ribbon (clearer entries)
Day Trading (15-60 Minute Charts)
Curvature Window: 5 (default)
Curvature Smoothing: 3 (balanced)
Volatility Length: 14
Momentum Length: 10
Tensor Gain: 1.5 (default)
Inflection Threshold: 0.15 (default)
Min Pivot Spacing: 5-8 bars
Pivot Mode: Normal or Adaptive
Ribbon Mode: Dual Ribbon
Swing Trading (4-Hour to Daily Charts)
Curvature Window: 7-10 (smoother)
Curvature Smoothing: 4-5 (noise reduction)
Volatility Length: 20-30
Momentum Length: 14-20
Tensor Gain: 1.8-2.5 (higher conviction requirement)
Inflection Threshold: 0.20-0.30 (more selective)
Min Pivot Spacing: 8-12 bars
Pivot Mode: Conservative
Ribbon Mode: Tension Cloud (focus on compression zones)
Performance Optimization
If you experience lag on lower-end systems:
Reduce Wave Layers: 4 → 2 (50% reduction in calculations)
Lower Particle Density: 3 → 1 (66% reduction in label creation)
Decrease Matrix History: 30 → 15 bars (50% reduction in table size)
Disable Tensor Waves entirely if not needed for your trading
Important Disclaimers
- This indicator is a technical analysis tool designed to identify potential pivot points through mathematical analysis of price trajectory geometry. It should not be used as a standalone trading system. Always combine with proper risk management, position sizing, and additional confirmation methods (support/resistance, volume analysis, multi-timeframe alignment).
- The curvature and tensor calculations are deterministic mathematical formulas applied to historical price data—they do not predict future price movements with certainty. Past geometric patterns do not guarantee future pivot behavior. The tension-based prediction system identifies conditions where pivots are likely to form based on trajectory straightness, but market conditions can change rapidly.
- All trading involves risk. Use appropriate stop losses and never risk more than you can afford to lose. The signal spacing filters and tensor confirmation layers are designed to reduce noise, but no indicator can eliminate false signals entirely.
This system is most effective when combined with sound trading principles, market context awareness, and disciplined execution.
Technical Notes
- All calculations execute on closed bars only (no repainting)
- Lookback functions limited to 5000 bars maximum
- Arrays are fixed-size (waves) or hard-capped (particles at 80 labels)
- Dashboard and matrix update only on the last bar to minimize computational load
- Particle generation throttled to every 2 bars
- Phase accumulators use modulo operations to prevent overflow
- Statistical normalization (mean ± 2σ) automatically adapts to different volatility regimes
— Dskyz, Trade with insight. Trade with anticipation.
Skript nur auf Einladung
Ausschließlich Nutzer mit einer Erlaubnis des Autors können Zugriff auf dieses Script erhalten. Sie müssen diese Genehmigung bei dem Autor beantragen. Dies umfasst üblicherweise auch eine Zahlung. Wenn Sie mehr erfahren möchten, dann sehen Sie sich unten die Anweisungen des Autors an oder kontaktieren Sie DskyzInvestments direkt.
TradingView empfiehlt NICHT, für die Nutzung eines Scripts zu bezahlen, wenn Sie den Autor nicht als vertrauenswürdig halten und verstehen, wie das Script funktioniert. Sie können außerdem auch kostenlose Open-Source-Alternativen in unseren Community-Scripts finden.
Hinweise des Autors
DAFETradingSystems.com
Haftungsausschluss
Skript nur auf Einladung
Ausschließlich Nutzer mit einer Erlaubnis des Autors können Zugriff auf dieses Script erhalten. Sie müssen diese Genehmigung bei dem Autor beantragen. Dies umfasst üblicherweise auch eine Zahlung. Wenn Sie mehr erfahren möchten, dann sehen Sie sich unten die Anweisungen des Autors an oder kontaktieren Sie DskyzInvestments direkt.
TradingView empfiehlt NICHT, für die Nutzung eines Scripts zu bezahlen, wenn Sie den Autor nicht als vertrauenswürdig halten und verstehen, wie das Script funktioniert. Sie können außerdem auch kostenlose Open-Source-Alternativen in unseren Community-Scripts finden.
Hinweise des Autors
DAFETradingSystems.com