PROTECTED SOURCE SCRIPT
Aktualisiert TWAP Oscillator
TWAP Oscillator (TOSC)
A powerful mean reversion oscillator that measures price deviation from Time-Weighted Average Price (TWAP) in standard deviations, automatically adapting to your chart timeframe.
How It Works:
The TWAP Oscillator calculates the distance between current price and TWAP, expressed in standard deviations. Unlike VWAP which weights by volume, TWAP gives equal weight to each time period, making it ideal for:
• Mean Reversion Trading - Identifies when price is statistically overextended from its time-weighted average
• Trend Strength Analysis - Shows how far price has deviated from the TWAP baseline
• Entry/Exit Timing - Provides objective levels for trade entries and exits
Automatic Timeframe Adaptation:
The indicator intelligently selects the appropriate TWAP period based on your chart timeframe:
1m Charts → 1D TWAP (intraday mean reversion)
3m-5m Charts → 7D TWAP (weekly perspective)
15m-1h Charts → 30D TWAP (monthly context)
4h-8h Charts → 90D TWAP (quarterly view)
Daily Charts → 365D TWAP (yearly reference)
Trading Days vs Calendar Days:
Toggle between trading days (5D, 22D, 66D, 252D) or calendar days (7D, 30D, 90D, 365D) to match your analysis style.
Divergence Analysis - High Probability Reversals:
The most powerful signals occur when price and oscillator diverge at extreme levels:
Bullish Divergence (Oversold):
• Price makes lower lows
• Oscillator makes higher lows
• Both at oversold levels (-2 or lower)
• Strong buy signal - price weakness not confirmed by TWAP
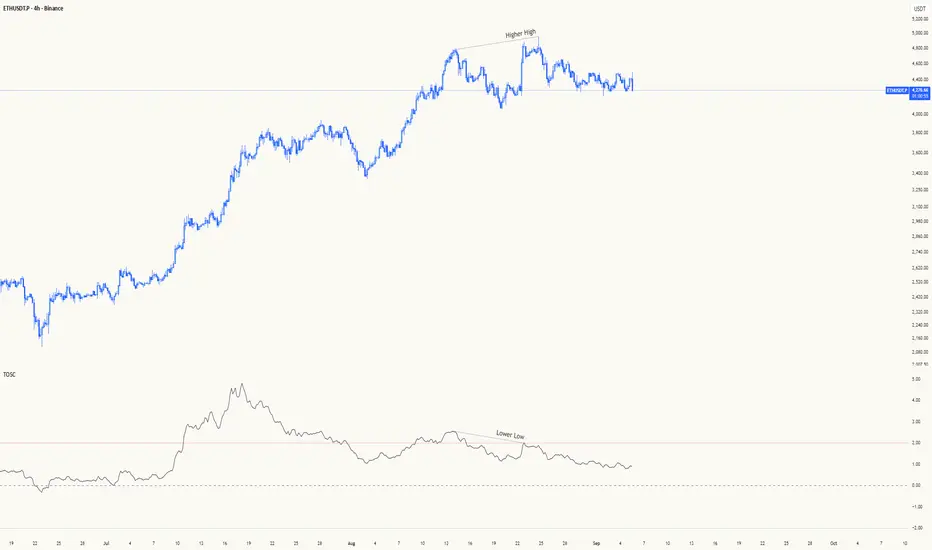
Bearish Divergence (Overbought):
• Price makes higher highs
• Oscillator makes lower highs
• Both at overbought levels (+2 or higher)
• Strong sell signal - price strength not confirmed by TWAP
Hidden Bullish Divergence:
• Price makes higher lows
• Oscillator makes lower lows
• At oversold levels
• Trend continuation signal - pullback in uptrend
Hidden Bearish Divergence:
• Price makes lower highs
• Oscillator makes higher highs
• At overbought levels
• Trend continuation signal - rally in downtrend
Divergence Confluence Zones:
Maximum Confluence Setup:
• Divergence at extreme levels (±2+ std dev)
• Multiple timeframe confirmation
• Key support/resistance levels
• Volume confirmation
• Highest probability reversal
Divergence Trading Rules:
• Wait for clear divergence formation
• Confirm at extreme oscillator levels
• Enter on divergence confirmation
• Stop loss beyond recent swing
• Target return to zero line or opposite extreme
Key Features:
• Zero Line - Neutral position where price equals TWAP
• Overbought/Oversold Levels - Default ±2 standard deviations (customizable)
• Smoothing - SMA filter to reduce noise
• Info Table - Shows current values and timeframe mapping
• Alerts - Zero line crosses and overbought/oversold conditions
Trading Applications:
Mean Reversion Strategy:
• Enter long when oscillator crosses above oversold level (-2)
• Enter short when oscillator crosses below overbought level (+2)
• Exit when returning to zero line
Trend Following:
• Stay long while oscillator remains above zero
• Stay short while oscillator remains below zero
• Use extreme readings as potential reversal signals
Risk Management:
• Use overbought/oversold levels as stop-loss references
• Scale position size based on oscillator magnitude
• Combine with other indicators for confirmation
Mathematical Foundation:
Oscillator = (Current Price - TWAP) / Standard Deviation
Where:
• TWAP = Time-weighted average price over selected period
• Standard Deviation = Statistical measure of price dispersion
• Result = Number of standard deviations from mean
Best Practices:
• Use on higher timeframes for trend analysis
• Use on lower timeframes for entry timing
• Combine with volume analysis for confirmation
• Adjust overbought/oversold levels based on market volatility
• Consider market structure and support/resistance levels
Perfect For:
•Scalping - 1m charts with 1D TWAP
•Day Trading - 5m-15m charts with 7D TWAP
•Swing Trading - 1h-4h charts with 30D TWAP
•Position Trading - Daily charts with 365D TWAP
A powerful mean reversion oscillator that measures price deviation from Time-Weighted Average Price (TWAP) in standard deviations, automatically adapting to your chart timeframe.
How It Works:
The TWAP Oscillator calculates the distance between current price and TWAP, expressed in standard deviations. Unlike VWAP which weights by volume, TWAP gives equal weight to each time period, making it ideal for:
• Mean Reversion Trading - Identifies when price is statistically overextended from its time-weighted average
• Trend Strength Analysis - Shows how far price has deviated from the TWAP baseline
• Entry/Exit Timing - Provides objective levels for trade entries and exits
Automatic Timeframe Adaptation:
The indicator intelligently selects the appropriate TWAP period based on your chart timeframe:
Trading Days vs Calendar Days:
Toggle between trading days (5D, 22D, 66D, 252D) or calendar days (7D, 30D, 90D, 365D) to match your analysis style.
Divergence Analysis - High Probability Reversals:
The most powerful signals occur when price and oscillator diverge at extreme levels:
Bullish Divergence (Oversold):
• Price makes lower lows
• Oscillator makes higher lows
• Both at oversold levels (-2 or lower)
• Strong buy signal - price weakness not confirmed by TWAP
Bearish Divergence (Overbought):
• Price makes higher highs
• Oscillator makes lower highs
• Both at overbought levels (+2 or higher)
• Strong sell signal - price strength not confirmed by TWAP
Hidden Bullish Divergence:
• Price makes higher lows
• Oscillator makes lower lows
• At oversold levels
• Trend continuation signal - pullback in uptrend
Hidden Bearish Divergence:
• Price makes lower highs
• Oscillator makes higher highs
• At overbought levels
• Trend continuation signal - rally in downtrend
Divergence Confluence Zones:
Maximum Confluence Setup:
• Divergence at extreme levels (±2+ std dev)
• Multiple timeframe confirmation
• Key support/resistance levels
• Volume confirmation
• Highest probability reversal
Divergence Trading Rules:
• Wait for clear divergence formation
• Confirm at extreme oscillator levels
• Enter on divergence confirmation
• Stop loss beyond recent swing
• Target return to zero line or opposite extreme
Key Features:
• Zero Line - Neutral position where price equals TWAP
• Overbought/Oversold Levels - Default ±2 standard deviations (customizable)
• Smoothing - SMA filter to reduce noise
• Info Table - Shows current values and timeframe mapping
• Alerts - Zero line crosses and overbought/oversold conditions
Trading Applications:
Mean Reversion Strategy:
• Enter long when oscillator crosses above oversold level (-2)
• Enter short when oscillator crosses below overbought level (+2)
• Exit when returning to zero line
Trend Following:
• Stay long while oscillator remains above zero
• Stay short while oscillator remains below zero
• Use extreme readings as potential reversal signals
Risk Management:
• Use overbought/oversold levels as stop-loss references
• Scale position size based on oscillator magnitude
• Combine with other indicators for confirmation
Mathematical Foundation:
Oscillator = (Current Price - TWAP) / Standard Deviation
Where:
• TWAP = Time-weighted average price over selected period
• Standard Deviation = Statistical measure of price dispersion
• Result = Number of standard deviations from mean
Best Practices:
• Use on higher timeframes for trend analysis
• Use on lower timeframes for entry timing
• Combine with volume analysis for confirmation
• Adjust overbought/oversold levels based on market volatility
• Consider market structure and support/resistance levels
Perfect For:
•
•
•
•
Versionshinweise
- Added +- LevelVersionshinweise
- Time UpdatesVersionshinweise
- OKVersionshinweise
- Added Re AnchoringVersionshinweise
- Updated SessionsGeschütztes Skript
Dieses Script ist als Closed-Source veröffentlicht. Sie können es kostenlos und ohne Einschränkungen verwenden – erfahren Sie hier mehr.
Haftungsausschluss
Die Informationen und Veröffentlichungen sind nicht als Finanz-, Anlage-, Handels- oder andere Arten von Ratschlägen oder Empfehlungen gedacht, die von TradingView bereitgestellt oder gebilligt werden, und stellen diese nicht dar. Lesen Sie mehr in den Nutzungsbedingungen.
Geschütztes Skript
Dieses Script ist als Closed-Source veröffentlicht. Sie können es kostenlos und ohne Einschränkungen verwenden – erfahren Sie hier mehr.
Haftungsausschluss
Die Informationen und Veröffentlichungen sind nicht als Finanz-, Anlage-, Handels- oder andere Arten von Ratschlägen oder Empfehlungen gedacht, die von TradingView bereitgestellt oder gebilligt werden, und stellen diese nicht dar. Lesen Sie mehr in den Nutzungsbedingungen.