PROTECTED SOURCE SCRIPT
Complete Pivot Ranges
I forgot what book I read this from. But basically a successful trader would create a range using the open/high/low/close of the previous day, and the high/low of the previous day.
I created the indicator from the book, but also added a few other pivots to it. You can hide the ones you don't need in settings.
He also mentioned that the resistance of this area is a lot like a samurai and armour, and that if price falls through the pivot, it will fall faster. Just like a sword that penetrates armour will go straight through your body.
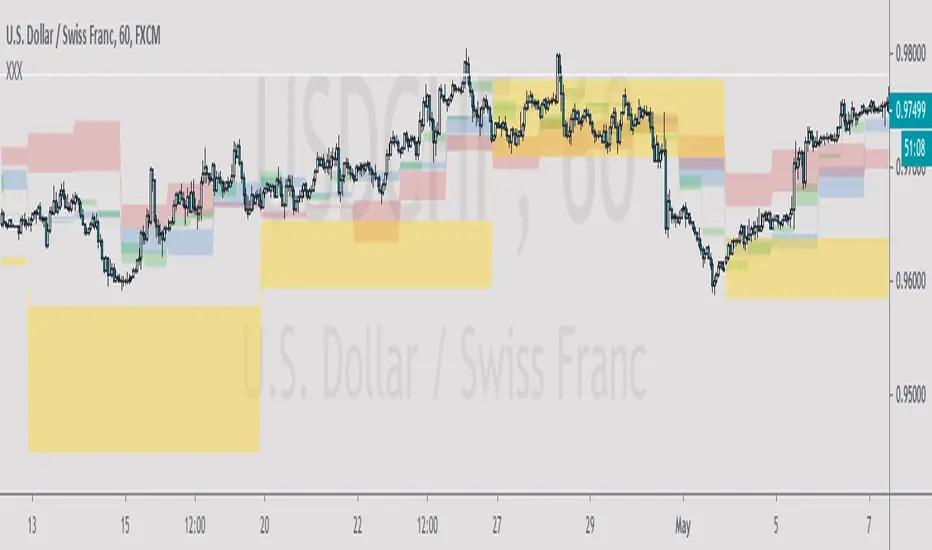
Green = half day pivot. :: I've noticed price can be rejected from these areas against the trend during the day
Blue = daily pivot. :: My favourite. You can see how the trend is going by checking how it steps. There is good value in putting orders on in this range, especially when price is touching a 50 ema on the 15 min chart.
Red = 5 day rolling pivot :: collects the open/high/low/close of the last 5 days and makes a daily range with them. Best used with 50ema on the hour chart. The book used a 3 day rolling pivot but I find this more useful.
Yellow = 5 week rolling pivot :: like the red rolling pivot above but using the last 5 weeks. Best on 4 hour chart.
As with all indicators see if it can give you value and if it's right for your trading.
Cheers
I created the indicator from the book, but also added a few other pivots to it. You can hide the ones you don't need in settings.
He also mentioned that the resistance of this area is a lot like a samurai and armour, and that if price falls through the pivot, it will fall faster. Just like a sword that penetrates armour will go straight through your body.
Green = half day pivot. :: I've noticed price can be rejected from these areas against the trend during the day
Blue = daily pivot. :: My favourite. You can see how the trend is going by checking how it steps. There is good value in putting orders on in this range, especially when price is touching a 50 ema on the 15 min chart.
Red = 5 day rolling pivot :: collects the open/high/low/close of the last 5 days and makes a daily range with them. Best used with 50ema on the hour chart. The book used a 3 day rolling pivot but I find this more useful.
Yellow = 5 week rolling pivot :: like the red rolling pivot above but using the last 5 weeks. Best on 4 hour chart.
As with all indicators see if it can give you value and if it's right for your trading.
Cheers
Geschütztes Skript
Dieses Script ist als Closed-Source veröffentlicht. Sie können es kostenlos und ohne Einschränkungen verwenden – erfahren Sie hier mehr.
Haftungsausschluss
Die Informationen und Veröffentlichungen sind nicht als Finanz-, Anlage-, Handels- oder andere Arten von Ratschlägen oder Empfehlungen gedacht, die von TradingView bereitgestellt oder gebilligt werden, und stellen diese nicht dar. Lesen Sie mehr in den Nutzungsbedingungen.