VolatWave‴ | Volatility Wave‴
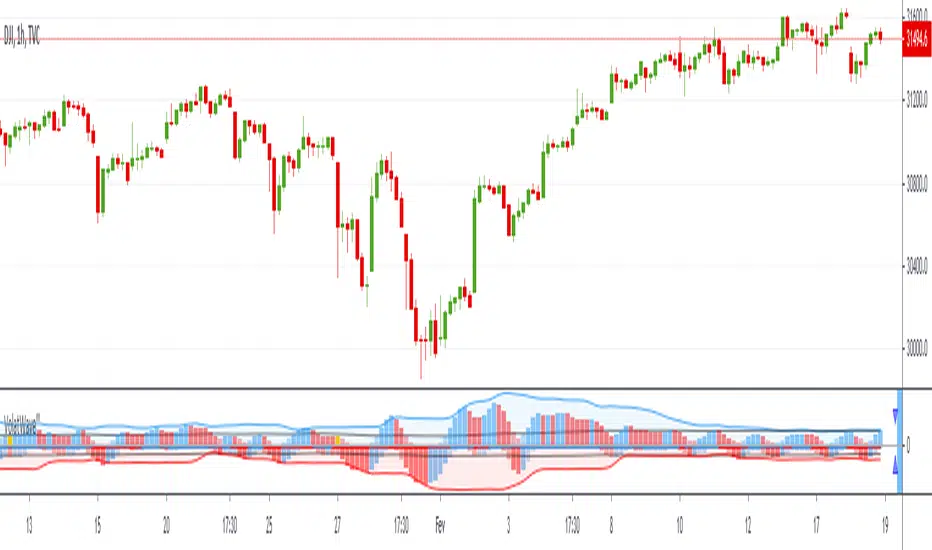
This indicator allows you to identify possible asset top and bottom reversals by having a prior Volatility acting among the price movement with a sequential positive (top reversal) or negative (bottom reversal) waves.
How does it work?
Everytime the wave starts showing a curved top movement (ascending price movment) or a curved bottom movement (descending price movment), it might be signing that a price reversal is on its way. It is possible to adjust the wave shape by increasing/decreasing its gradient value analysis, but it's so easy to use that most of the times no reconfiguration is needed, just add it and let it guide you.
Important to mention that the positive wave band, histogram bars and moving average line are calculate totally separete from the the negative wave.
What's my filling?
I'm still testing this indicator for only a week and so far still trying to understand its signs. I'm using it in conjunction with Volume Wave (VolWave) and Price Spread Wave (PSWave).
Indicator attributes:
- generally waves formation makes a symmetrical arc
- when the second half of a wave is elongated (compared to its first half), it suggests a lack of directional force of the current movement
- peak / bottom formation suggests reversal of the current movement
- smaller amplitude of a wave (compared to the previous wave) suggests loss of power, and vice-verse
- indicates divergence indication between peaks / bottoms
- when the volatility bar touches the volatility wave band, it suggests imminent reversal of the current movement
- wave band opening suggests movement increasing strength in that direction
- wavelengths (distance between two peaks / bottoms) tend to be similar
- subsequent wave rarely occurs
Technical information:
- the calculation of the positive movement is independent of the calculation of the positive movement
- the black line in the upper and lower zone is the average of the wave that is overcome, suggests strength in movement
- bands suggest delimitation of a wave's peak / bottom
To have access to this indicator, please DM me.
Don't contact me in the comment area.
Skript nur auf Einladung
Ausschließlich Nutzer mit einer Erlaubnis des Autors können Zugriff auf dieses Script erhalten. Sie müssen diese Genehmigung bei dem Autor beantragen. Dies umfasst üblicherweise auch eine Zahlung. Wenn Sie mehr erfahren möchten, dann sehen Sie sich unten die Anweisungen des Autors an oder kontaktieren Sie MarceloTorres direkt.
TradingView empfiehlt NICHT, für die Nutzung eines Scripts zu bezahlen, wenn Sie den Autor nicht als vertrauenswürdig halten und verstehen, wie das Script funktioniert. Sie können außerdem auch kostenlose Open-Source-Alternativen in unseren Community-Scripts finden.
Hinweise des Autors
marcelo@tradewiser.pro
Vídeo-Análise completa diária no YouTube:
youtube.com/c/TradeWiserPro
Curso/AE
CursoAE.TradeWiser.pro
@TradeWiserPro
Telegram, Twitter, Facebook, LinkedIn, Instagram
Haftungsausschluss
Skript nur auf Einladung
Ausschließlich Nutzer mit einer Erlaubnis des Autors können Zugriff auf dieses Script erhalten. Sie müssen diese Genehmigung bei dem Autor beantragen. Dies umfasst üblicherweise auch eine Zahlung. Wenn Sie mehr erfahren möchten, dann sehen Sie sich unten die Anweisungen des Autors an oder kontaktieren Sie MarceloTorres direkt.
TradingView empfiehlt NICHT, für die Nutzung eines Scripts zu bezahlen, wenn Sie den Autor nicht als vertrauenswürdig halten und verstehen, wie das Script funktioniert. Sie können außerdem auch kostenlose Open-Source-Alternativen in unseren Community-Scripts finden.
Hinweise des Autors
marcelo@tradewiser.pro
Vídeo-Análise completa diária no YouTube:
youtube.com/c/TradeWiserPro
Curso/AE
CursoAE.TradeWiser.pro
@TradeWiserPro
Telegram, Twitter, Facebook, LinkedIn, Instagram