PROTECTED SOURCE SCRIPT
Aktualisiert Correlation of Price Spread and Volume
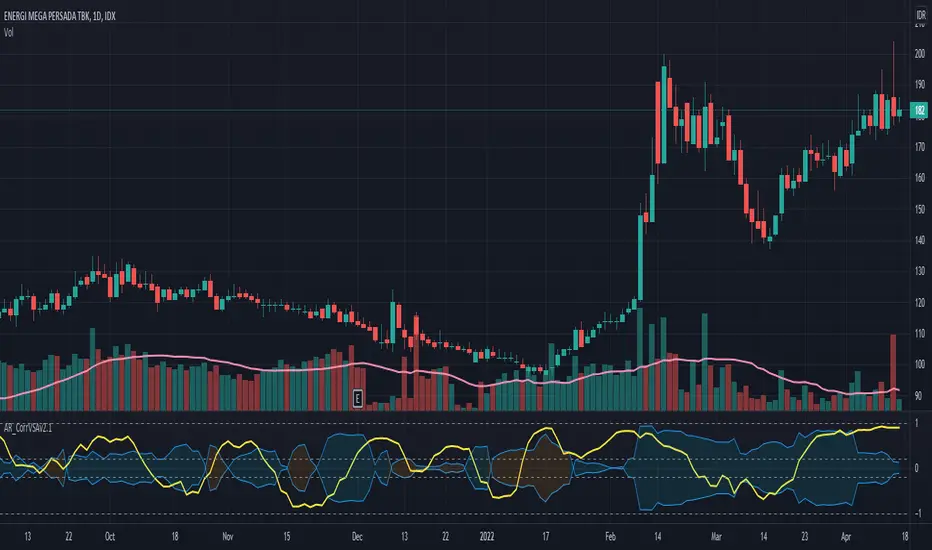
Correlation between candle's price spread (length of candle of each bar) and volume.
Generally, increases in volume precede significant price movements. However, If the price is rising in an uptrend but the volume is reducing, it may show that there’s little interest in the instrument, and the price may reverse.
The closer the correlation is to 1.0, indicates the instruments will move up and down together as it is expected with volume and price spread. So the correlation Indicator aims to display when the price spread and volume is in correlation and not. Blue color represent positive correlation while orange negative correlation. The strength of the correlation is determined by the width of the bands.
Versionshinweise
Added horizontal lines to indicate the strength of the correlation (default 0.2).Versionshinweise
Updated the titleVersionshinweise
Fix the algorithmVersionshinweise
Added yellow line for the correlation with the user-selected instrument.Versionshinweise
Changed the default length parameterGeschütztes Skript
Dieses Script ist als Closed-Source veröffentlicht. Sie können es kostenlos und ohne Einschränkungen verwenden – erfahren Sie hier mehr.
Haftungsausschluss
Die Informationen und Veröffentlichungen sind nicht als Finanz-, Anlage-, Handels- oder andere Arten von Ratschlägen oder Empfehlungen gedacht, die von TradingView bereitgestellt oder gebilligt werden, und stellen diese nicht dar. Lesen Sie mehr in den Nutzungsbedingungen.
Geschütztes Skript
Dieses Script ist als Closed-Source veröffentlicht. Sie können es kostenlos und ohne Einschränkungen verwenden – erfahren Sie hier mehr.
Haftungsausschluss
Die Informationen und Veröffentlichungen sind nicht als Finanz-, Anlage-, Handels- oder andere Arten von Ratschlägen oder Empfehlungen gedacht, die von TradingView bereitgestellt oder gebilligt werden, und stellen diese nicht dar. Lesen Sie mehr in den Nutzungsbedingungen.