PROTECTED SOURCE SCRIPT
Yield curve indicator trial
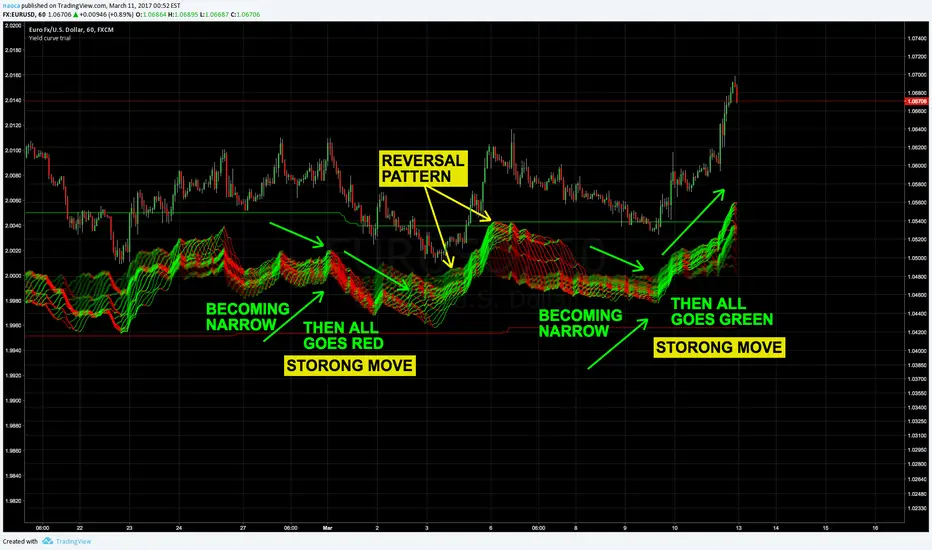
This indicator shows the multiple time frame yield curves of chart.
It’s useful to understand how much good or bad is the performance for short-term & long-term traders.
Near side of lines indicates longer term yield.
And far side of lines indicates shorter term of yield.
While it’s ascending, its color is green & if not it will be red.
- - - - - - - - - - - - - - - - - - - - - - - - - - - - - -
This is trial version. You can check how it works on any chart!
* Data before March. 17th, 2017 can be shown.
More information:
tradeindicator.tumblr.com/post/158257399947/yield-curve-indicator
tradeindicator.tumblr.com/
Geschütztes Skript
Dieses Script ist als Closed-Source veröffentlicht. Sie können es kostenlos und ohne Einschränkungen verwenden – erfahren Sie hier mehr.
Haftungsausschluss
Die Informationen und Veröffentlichungen sind nicht als Finanz-, Anlage-, Handels- oder andere Arten von Ratschlägen oder Empfehlungen gedacht, die von TradingView bereitgestellt oder gebilligt werden, und stellen diese nicht dar. Lesen Sie mehr in den Nutzungsbedingungen.