Key Levels with RTH-Only Lines and End-of-Line Labels
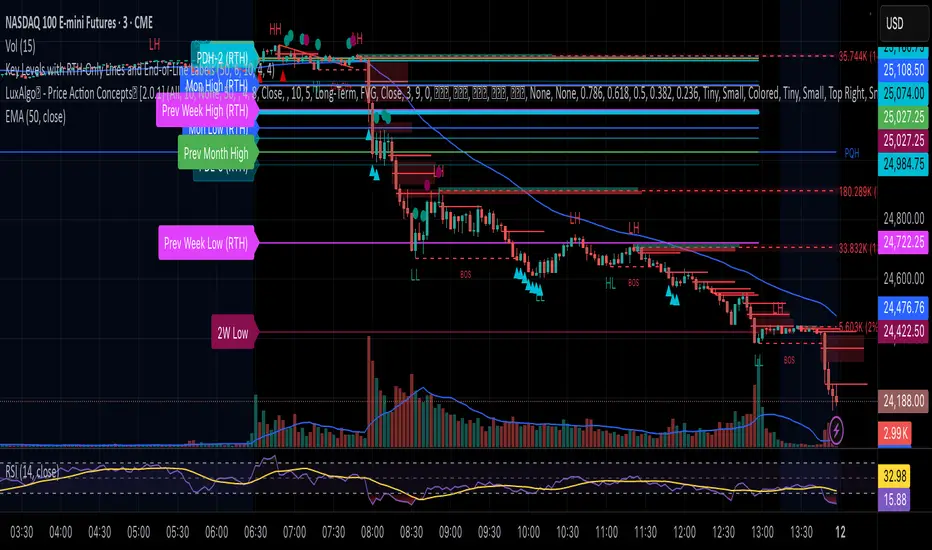
Each level is automatically updated based on session data and is visually extended across the current trading day using line breaks (plot.style_linebr). At the start of each RTH session, the script also places end-of-line labels identifying each level (e.g., PDH, PDL, Mon High, Mon Low, Weekly High/Low, Monthly High/Low), allowing traders to quickly reference key zones without clutter.
This tool is ideal for:
Futures and equity traders who rely on session-based support and resistance levels.
Identifying reaction points where liquidity often builds — such as prior highs/lows or weekly extremes.
Maintaining focus on live market structure while avoiding noise from premarket or overnight price action.
Additional features:
All levels and labels are plotted only during RTH for visual clarity.
Supports custom labeling and alert logic extensions for breakout or retest strategies.
Built with scalability in mind — works across different symbols and timeframes.
Skript nur auf Einladung
Ausschließlich Nutzer mit einer Erlaubnis des Autors können Zugriff auf dieses Script erhalten. Sie müssen diese Genehmigung bei dem Autor beantragen. Dies umfasst üblicherweise auch eine Zahlung. Wenn Sie mehr erfahren möchten, dann sehen Sie sich unten die Anweisungen des Autors an oder kontaktieren Sie govind220 direkt.
TradingView empfiehlt NICHT, für die Nutzung eines Scripts zu bezahlen, wenn Sie den Autor nicht als vertrauenswürdig halten und verstehen, wie das Script funktioniert. Sie können außerdem auch kostenlose Open-Source-Alternativen in unseren Community-Scripts finden.
Hinweise des Autors
Haftungsausschluss
Skript nur auf Einladung
Ausschließlich Nutzer mit einer Erlaubnis des Autors können Zugriff auf dieses Script erhalten. Sie müssen diese Genehmigung bei dem Autor beantragen. Dies umfasst üblicherweise auch eine Zahlung. Wenn Sie mehr erfahren möchten, dann sehen Sie sich unten die Anweisungen des Autors an oder kontaktieren Sie govind220 direkt.
TradingView empfiehlt NICHT, für die Nutzung eines Scripts zu bezahlen, wenn Sie den Autor nicht als vertrauenswürdig halten und verstehen, wie das Script funktioniert. Sie können außerdem auch kostenlose Open-Source-Alternativen in unseren Community-Scripts finden.