OPEN-SOURCE SCRIPT
Institutional Supply and Demand Zones
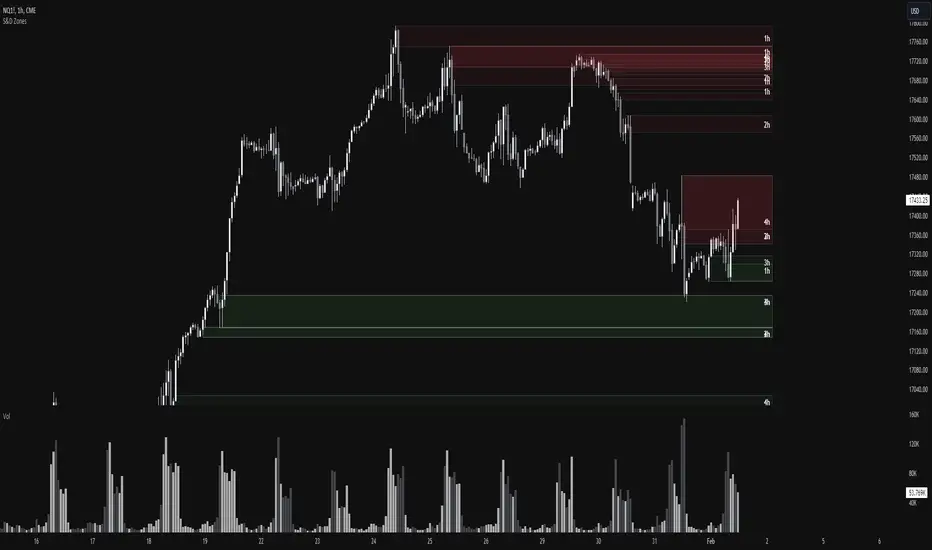
This indicator aims to identify price levels where institutional investors have positioned their buy or sell orders. These buy orders establish "demand zones," while sell orders create "supply zones." Identifying these zones enables us to anticipate potential reversals in price trends, allowing us to profitably engage in these significant market movements alongside major institutions. These zones are formed when price action goes from balanced to imbalanced. These zones are based on orders. Unlike standard support and resistance levels, when price breaks below a demand zone or above a supply zone, these zones disappear from the chart.
Supply is formed by a green candle followed by a major red candle that is at least double the size of previous green candle. The zone is then charted from the open of the green candle to the highest point in the candle. Vice versa for a demand zone (red into green).
These zones are traded by:
1. Look for a volume spike in a zone
2. A trend/trendline break out of the zone
Open-source Skript
Ganz im Sinne von TradingView hat dieser Autor sein/ihr Script als Open-Source veröffentlicht. Auf diese Weise können nun das Script auch andere Trader verstehen und prüfen. Vielen Dank an den Autor! Sie können das Script kostenlos verwenden. Die Nutzung dieses Codes in einer Veröffentlichung wird in unseren Hausregeln reguliert. Sie können es als Favoriten auswählen, um es in einem Chart zu verwenden.
Haftungsausschluss
Die Informationen und Veröffentlichungen sind nicht als Finanz-, Anlage-, Handels- oder andere Arten von Ratschlägen oder Empfehlungen gedacht, die von TradingView bereitgestellt oder gebilligt werden, und stellen diese nicht dar. Lesen Sie mehr in den Nutzungsbedingungen.