OPEN-SOURCE SCRIPT
Recursive Rsi
Introduction
I have already posted a classic indicator using recursion, it was the stochastic oscillator and recursion helped to get a more predictive and smooth result. Here i will do the same thing with the rsi oscillator but with a different approach. As reminder when using recursion you just use a fraction of the output of a function as input of the same function, i say a fraction because if you feedback the entire output you will just have a periodic function, this is why you average the output with the input.
The Indicator
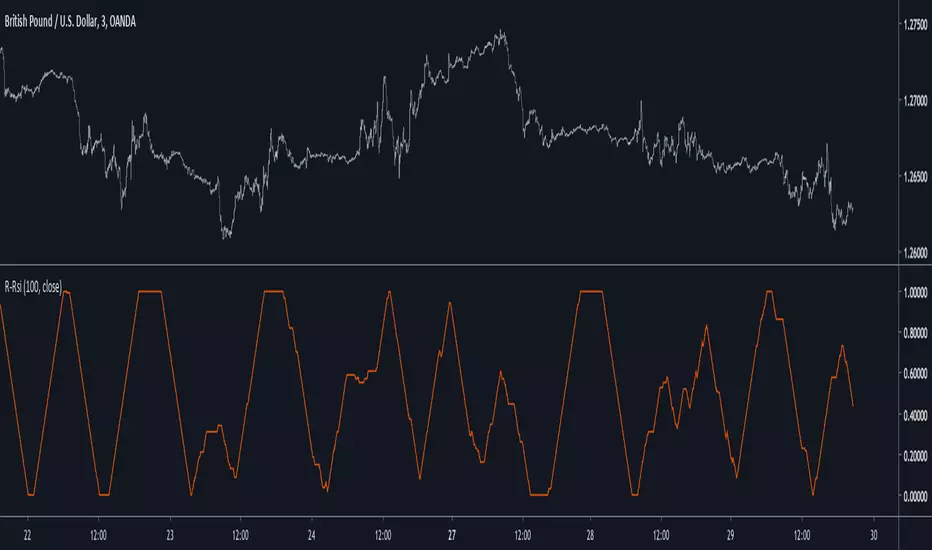
The indicator will use 50% of the output and 50% of the input, remember that when using feedback always rescale your input, else the effect might be different depending on the market you are in. You can interpret the indicator like a normal rsi except if you plan to use the 80/20 level, depending on length the scale might change, if you need a fixed scale you can always rescale b by using an rsi or stochastic oscillator.
Conclusion
I have presented an rsi oscillator using a different type of recursion structure than the recursive stochastic i posted in the past, the result might be more predictive than the original rsi. Hope you like it and thanks for reading !
I have already posted a classic indicator using recursion, it was the stochastic oscillator and recursion helped to get a more predictive and smooth result. Here i will do the same thing with the rsi oscillator but with a different approach. As reminder when using recursion you just use a fraction of the output of a function as input of the same function, i say a fraction because if you feedback the entire output you will just have a periodic function, this is why you average the output with the input.
The Indicator
The indicator will use 50% of the output and 50% of the input, remember that when using feedback always rescale your input, else the effect might be different depending on the market you are in. You can interpret the indicator like a normal rsi except if you plan to use the 80/20 level, depending on length the scale might change, if you need a fixed scale you can always rescale b by using an rsi or stochastic oscillator.
Conclusion
I have presented an rsi oscillator using a different type of recursion structure than the recursive stochastic i posted in the past, the result might be more predictive than the original rsi. Hope you like it and thanks for reading !
Open-source Skript
Ganz im Sinne von TradingView hat dieser Autor sein/ihr Script als Open-Source veröffentlicht. Auf diese Weise können nun auch andere Trader das Script rezensieren und die Funktionalität überprüfen. Vielen Dank an den Autor! Sie können das Script kostenlos verwenden, aber eine Wiederveröffentlichung des Codes unterliegt unseren Hausregeln.
Check out the indicators we are making at luxalgo: tradingview.com/u/LuxAlgo/
"My heart is so loud that I can't hear the fireworks"
"My heart is so loud that I can't hear the fireworks"
Haftungsausschluss
Die Informationen und Veröffentlichungen sind nicht als Finanz-, Anlage-, Handels- oder andere Arten von Ratschlägen oder Empfehlungen gedacht, die von TradingView bereitgestellt oder gebilligt werden, und stellen diese nicht dar. Lesen Sie mehr in den Nutzungsbedingungen.