PROTECTED SOURCE SCRIPT
Ywaves S/R
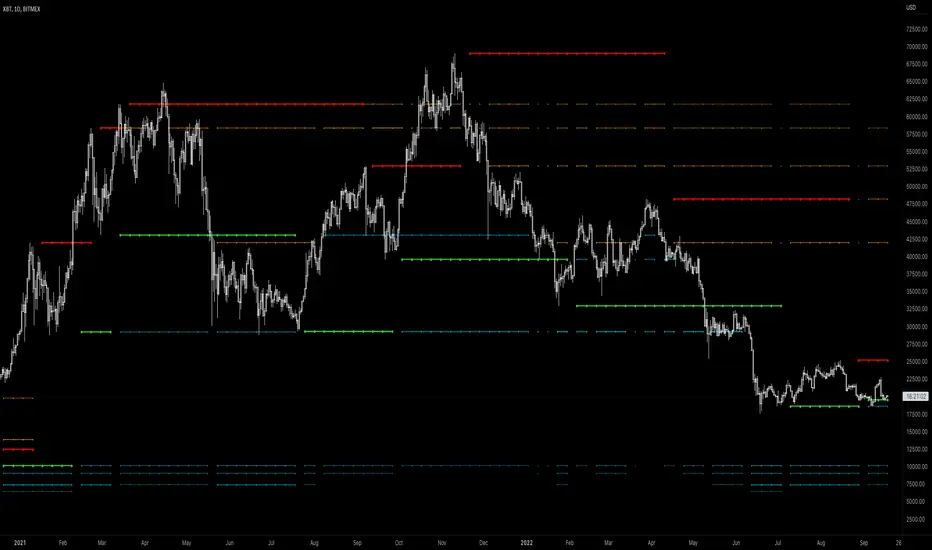
Ywaves identifies areas of extreme volatility that are out of the ordinary and highlights them for the trader. These areas are de facto areas of great interest for the market and therefore areas to monitor and work on. Thanks to a smoothing formula, it eliminates false positives that are sometimes too frequent and inconsistent.
This script uniquness reside in the formula used to determine the supports and resistances, by using multiple volatility tools, it is able to eliminate false positives and only keep interesting S/R.
The blue and orange S/Rs (secondary S/Rs) are echoes of the green/red S/Rs (main S/Rs) that are close (to the current price) to the past. There are a maximum of 5 levels of secondary S/R on either side of the price. The intensity of the color and the strength of the line also gives information about the proximity and importance of the S/R. When the blue/orange dots are connected, it means that it is the same S/R from the past that continues to be at the same level.
It is possible to use Ywaves in several ways: by using the main S/R, secondary S/R or clusters formed by the different S/R. Of course, the trader is free to work on other ways of using them. Thanks to the different settings, the trader can quickly display the supports and resistances close (in terms of price) to the past. The objective is once again to simplify the trader's life on a daily basis.
Geschütztes Skript
Dieses Script ist als Closed-Source veröffentlicht. Sie können es kostenlos und ohne Einschränkungen verwenden – erfahren Sie hier mehr.
Haftungsausschluss
Die Informationen und Veröffentlichungen sind nicht als Finanz-, Anlage-, Handels- oder andere Arten von Ratschlägen oder Empfehlungen gedacht, die von TradingView bereitgestellt oder gebilligt werden, und stellen diese nicht dar. Lesen Sie mehr in den Nutzungsbedingungen.