PROTECTED SOURCE SCRIPT
Aktualisiert BSArea - Buy/Sell Pressure Area Indicator
# 📊 BSArea - Buy/Sell Pressure Area Indicator
## Overview
The **BSArea (Buy/Sell Area)** indicator is an advanced swing point analysis tool that identifies and visualizes significant support and resistance zones based on pivot highs and lows. Unlike traditional pivot point indicators, BSArea measures the **actual trading activity** within these zones by tracking volume and bar count, providing traders with a quantitative measure of price rejection or acceptance at key levels.
## 🎯 Key Concept
When price approaches a previous swing high or low, one of two things typically occurs:
1. **Strong rejection** - Price bounces quickly with minimal trading activity
2. **Weak rejection/breakthrough** - Price lingers, accumulating volume before breaking through or reversing
BSArea quantifies this behavior by measuring how many bars and how much volume trades within these critical zones, giving you insight into the **strength of support and resistance levels**.
## 🔧 How It Works
### Pivot Point Detection
The indicator uses Pine Script's `ta.pivothigh()` and `ta.pivotlow()` functions to identify swing points with a customizable lookback period. Each pivot point creates a zone based on your selected area type:
**Wick Extremity**: Zone from the swing high/low to the candle body (default)
**Full Range**: Zone covering the entire candle range
### Volume and Bar Accumulation
Once a zone is established, the indicator begins tracking:
**Bar Count**: Number of candles that touch or overlap the zone
**Volume**: Cumulative volume from candles interacting with the zone
### Intrabar Precision (Optional)
Enable the "Intrabar Precision" feature to analyze lower timeframe data within each candle, providing more accurate volume measurements when price wicks into zones without closing inside them.
---
## 📈 Visual Components
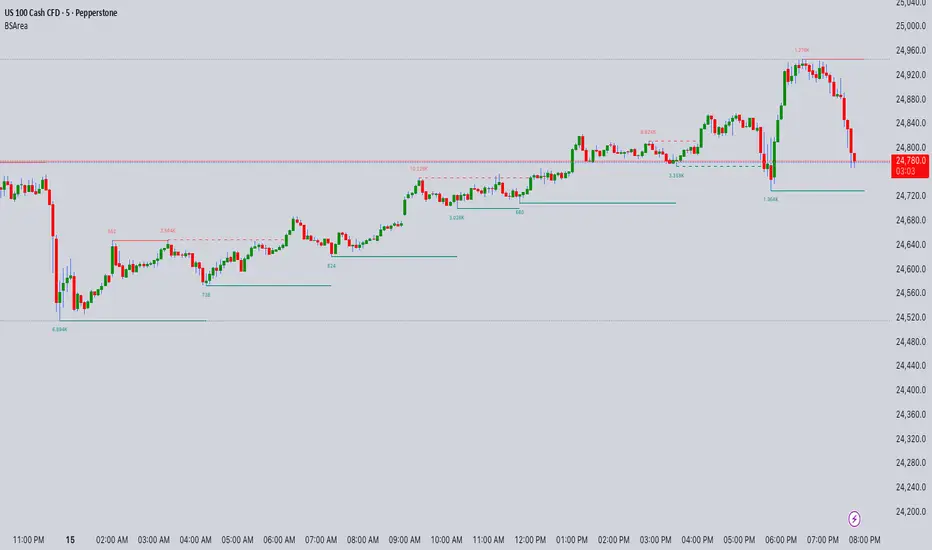
### 1. **Support/Resistance Zones** (Shaded Areas)
- **Red zones**: Previous swing highs (resistance)
- **Teal zones**: Previous swing lows (support)
- Zones extend rightward as long as they remain unbroken
- Zone width represents the number of bars that have interacted with the level
### 2. **Horizontal Lines**
- Solid lines mark active zones
- Dashed lines indicate broken/crossed levels
- Lines appear only when the volume/count threshold is met
### 3. **Volume Labels**
- Display accumulated volume within each zone
- Positioned at the swing point for easy reference
- Helps identify which levels have seen the most trading activity
---
## 🎛️ Settings & Parameters
### Core Settings
**Pivot Lookback** (Default: 14)
- Controls the sensitivity of swing point detection
- Lower values = more frequent, minor swings
- Higher values = fewer, more significant swings
**Swing Area Type**
*Wick Extremity*: Measures rejection from the extreme point to the candle body
*Full Range*: Measures the complete candle range
**Intrabar Precision**
- Enable to analyze lower timeframe data within candles
- Select the lower timeframe (default: 1 minute)
- Provides more accurate volume readings for zones
### Filtering Options
**Filter Areas By**
*Count*: Filter based on number of bars touching the zone
*Volume*: Filter based on cumulative volume in the zone
**Filter Value** (Default: 0)
- Minimum threshold for displaying zones and lines
- Set higher values to show only the most tested levels
- Helps reduce chart clutter on busy timeframes
### Styling
**Color Customization**
- Adjust colors for resistance zones, support zones, lines, and labels
- Transparency is pre-set but can be modified in the code
**Label Size**
- Choose between Tiny, Small, or Normal label sizes
- Affects the volume display readability
## 💡 Trading Applications
### 1. **Strength Assessment**
Higher volume and bar counts at a level indicate:
- Strong institutional interest
- Potential for significant breakout/breakdown
- Important decision points in the market
Lower counts suggest:
- Weak levels that may not hold
- Quick rejection zones
- Less significance for future tests
### 2. **Breakout Confirmation**
When price breaks through a high-volume zone:
- Watch for the line to turn dashed (indicates crossing)
- High volume breakouts are more reliable
- Consider the volume accumulated versus typical average volume
### 3. **Support/Resistance Trading**
**Bounce trades**: Look for low bar counts (quick rejection) at key levels
**Breakdown/Breakout trades**: High bar counts with increasing volume signal potential breaks
**Multiple tests**: Zones tested multiple times with increasing volume often break eventually
### 4. **Multi-Timeframe Analysis**
- Use higher timeframes (Daily, 4H) for major levels
- Use lower timeframes (15m, 1H) for intraday zones
- Combine with Intrabar Precision for accurate lower TF volume analysis
## 🔍 Understanding the Visuals
### Active Zone Example
Price approaches a previous high (red zone)
├─ Solid red line = Level not yet broken
├─ Expanding box = More bars testing the level
└─ Volume label = Total volume accumulated
### Broken Zone Example
Price breaks above a previous high
├─ Dashed red line = Level has been crossed
├─ Box stops expanding
└─ Historical reference remains visible
## 📚 Educational Value
### Key Concepts Demonstrated
1. **Volume Profile Principles**: Understanding where volume accumulates helps predict future price behavior
2. **Auction Theory**: Markets move from areas of high volume (fair value) to areas of low volume (inefficiency)
3. **Support/Resistance Dynamics**: Not all S/R levels are equal - volume tells the story
4. **Time at Price**: The longer price consolidates at a level, the more significant the eventual move
## ⚙️ Technical Details
### Performance Optimizations
- Uses `var` declarations for persistent variables to reduce memory usage
- Efficient array handling with lower timeframe data
- Maximum limits set (500 lines, labels, boxes) to prevent overload
### Compatibility
- Pine Script v5
- Works on all timeframes
- Compatible with all asset types (stocks, forex, crypto, futures)
- Lower timeframe requests work with any available resolution
## 🎓 Best Practices
### For Day Traders
- Use 5-15 minute charts with Intrabar Precision
- Set pivot lookback to 7-10 for faster signals
- Filter by count (threshold: 2-3) to see active zones
### For Swing Traders
- Use 1H-4H charts as primary timeframe
- Set pivot lookback to 10-20 for stronger levels
- Filter by volume to identify institutional zones
### For Position Traders
- Use Daily or Weekly charts
- Set pivot lookback to 14-28 for major pivots
- Focus on zones with high volume accumulation
## 🚫 Limitations & Disclaimers
### What This Indicator Does NOT Do
- Does not predict future price movements
- Does not generate buy/sell signals
- Does not guarantee support/resistance will hold
- Does not account for fundamental factors or news events
### Important Notes
- Historical volume does not guarantee future behavior
- Always use proper risk management
- Combine with other forms of analysis
- Markets can remain irrational longer than you can remain solvent
### Educational Purpose
This indicator is designed for **educational and analytical purposes only**. It is not financial advice, and should not be the sole basis for trading decisions. Users are responsible for their own trading choices and risk management.
## 🔄 Version History
**v1.0** - Initial Release
- Pivot-based zone detection
- Volume and bar count accumulation
- Intrabar precision analysis
- Customizable filtering and styling
- Multiple area calculation methods
## 🤝 Credits & Inspiration
This indicator builds upon classical pivot point analysis while incorporating volume profile concepts to provide a more comprehensive view of support and resistance dynamics. The combination of time-at-price and volume analysis offers traders a quantitative approach to level assessment.
## 📝 Usage Notes
1. **Start with default settings** to understand how the indicator behaves on your preferred timeframe
2. **Adjust the pivot lookback** based on the timeframe and asset volatility
3. **Use filtering** to reduce noise and focus on significant zones
4. **Enable Intrabar Precision** for more accurate volume readings on lower timeframes
5. **Combine with price action** analysis for best results
## ⚡ Quick Start Guide
1. Add the indicator to your chart
2. Observe the red (resistance) and teal (support) zones forming at swing points
3. Watch the volume labels accumulate as price tests these levels
4. Note when lines turn dashed (level broken) vs solid (level holding)
5. Use higher volume zones as more significant levels for your analysis
**Remember**: No indicator is perfect. Always use multiple forms of analysis, practice proper risk management, and trade according to your own risk tolerance and strategy.
*If you find this indicator useful, please leave a rating and share your feedback. Your input helps improve future versions and assists other traders in the community.*
## Overview
The **BSArea (Buy/Sell Area)** indicator is an advanced swing point analysis tool that identifies and visualizes significant support and resistance zones based on pivot highs and lows. Unlike traditional pivot point indicators, BSArea measures the **actual trading activity** within these zones by tracking volume and bar count, providing traders with a quantitative measure of price rejection or acceptance at key levels.
## 🎯 Key Concept
When price approaches a previous swing high or low, one of two things typically occurs:
1. **Strong rejection** - Price bounces quickly with minimal trading activity
2. **Weak rejection/breakthrough** - Price lingers, accumulating volume before breaking through or reversing
BSArea quantifies this behavior by measuring how many bars and how much volume trades within these critical zones, giving you insight into the **strength of support and resistance levels**.
## 🔧 How It Works
### Pivot Point Detection
The indicator uses Pine Script's `ta.pivothigh()` and `ta.pivotlow()` functions to identify swing points with a customizable lookback period. Each pivot point creates a zone based on your selected area type:
**Wick Extremity**: Zone from the swing high/low to the candle body (default)
**Full Range**: Zone covering the entire candle range
### Volume and Bar Accumulation
Once a zone is established, the indicator begins tracking:
**Bar Count**: Number of candles that touch or overlap the zone
**Volume**: Cumulative volume from candles interacting with the zone
### Intrabar Precision (Optional)
Enable the "Intrabar Precision" feature to analyze lower timeframe data within each candle, providing more accurate volume measurements when price wicks into zones without closing inside them.
---
## 📈 Visual Components
### 1. **Support/Resistance Zones** (Shaded Areas)
- **Red zones**: Previous swing highs (resistance)
- **Teal zones**: Previous swing lows (support)
- Zones extend rightward as long as they remain unbroken
- Zone width represents the number of bars that have interacted with the level
### 2. **Horizontal Lines**
- Solid lines mark active zones
- Dashed lines indicate broken/crossed levels
- Lines appear only when the volume/count threshold is met
### 3. **Volume Labels**
- Display accumulated volume within each zone
- Positioned at the swing point for easy reference
- Helps identify which levels have seen the most trading activity
---
## 🎛️ Settings & Parameters
### Core Settings
**Pivot Lookback** (Default: 14)
- Controls the sensitivity of swing point detection
- Lower values = more frequent, minor swings
- Higher values = fewer, more significant swings
**Swing Area Type**
*Wick Extremity*: Measures rejection from the extreme point to the candle body
*Full Range*: Measures the complete candle range
**Intrabar Precision**
- Enable to analyze lower timeframe data within candles
- Select the lower timeframe (default: 1 minute)
- Provides more accurate volume readings for zones
### Filtering Options
**Filter Areas By**
*Count*: Filter based on number of bars touching the zone
*Volume*: Filter based on cumulative volume in the zone
**Filter Value** (Default: 0)
- Minimum threshold for displaying zones and lines
- Set higher values to show only the most tested levels
- Helps reduce chart clutter on busy timeframes
### Styling
**Color Customization**
- Adjust colors for resistance zones, support zones, lines, and labels
- Transparency is pre-set but can be modified in the code
**Label Size**
- Choose between Tiny, Small, or Normal label sizes
- Affects the volume display readability
## 💡 Trading Applications
### 1. **Strength Assessment**
Higher volume and bar counts at a level indicate:
- Strong institutional interest
- Potential for significant breakout/breakdown
- Important decision points in the market
Lower counts suggest:
- Weak levels that may not hold
- Quick rejection zones
- Less significance for future tests
### 2. **Breakout Confirmation**
When price breaks through a high-volume zone:
- Watch for the line to turn dashed (indicates crossing)
- High volume breakouts are more reliable
- Consider the volume accumulated versus typical average volume
### 3. **Support/Resistance Trading**
**Bounce trades**: Look for low bar counts (quick rejection) at key levels
**Breakdown/Breakout trades**: High bar counts with increasing volume signal potential breaks
**Multiple tests**: Zones tested multiple times with increasing volume often break eventually
### 4. **Multi-Timeframe Analysis**
- Use higher timeframes (Daily, 4H) for major levels
- Use lower timeframes (15m, 1H) for intraday zones
- Combine with Intrabar Precision for accurate lower TF volume analysis
## 🔍 Understanding the Visuals
### Active Zone Example
Price approaches a previous high (red zone)
├─ Solid red line = Level not yet broken
├─ Expanding box = More bars testing the level
└─ Volume label = Total volume accumulated
### Broken Zone Example
Price breaks above a previous high
├─ Dashed red line = Level has been crossed
├─ Box stops expanding
└─ Historical reference remains visible
## 📚 Educational Value
### Key Concepts Demonstrated
1. **Volume Profile Principles**: Understanding where volume accumulates helps predict future price behavior
2. **Auction Theory**: Markets move from areas of high volume (fair value) to areas of low volume (inefficiency)
3. **Support/Resistance Dynamics**: Not all S/R levels are equal - volume tells the story
4. **Time at Price**: The longer price consolidates at a level, the more significant the eventual move
## ⚙️ Technical Details
### Performance Optimizations
- Uses `var` declarations for persistent variables to reduce memory usage
- Efficient array handling with lower timeframe data
- Maximum limits set (500 lines, labels, boxes) to prevent overload
### Compatibility
- Pine Script v5
- Works on all timeframes
- Compatible with all asset types (stocks, forex, crypto, futures)
- Lower timeframe requests work with any available resolution
## 🎓 Best Practices
### For Day Traders
- Use 5-15 minute charts with Intrabar Precision
- Set pivot lookback to 7-10 for faster signals
- Filter by count (threshold: 2-3) to see active zones
### For Swing Traders
- Use 1H-4H charts as primary timeframe
- Set pivot lookback to 10-20 for stronger levels
- Filter by volume to identify institutional zones
### For Position Traders
- Use Daily or Weekly charts
- Set pivot lookback to 14-28 for major pivots
- Focus on zones with high volume accumulation
## 🚫 Limitations & Disclaimers
### What This Indicator Does NOT Do
- Does not predict future price movements
- Does not generate buy/sell signals
- Does not guarantee support/resistance will hold
- Does not account for fundamental factors or news events
### Important Notes
- Historical volume does not guarantee future behavior
- Always use proper risk management
- Combine with other forms of analysis
- Markets can remain irrational longer than you can remain solvent
### Educational Purpose
This indicator is designed for **educational and analytical purposes only**. It is not financial advice, and should not be the sole basis for trading decisions. Users are responsible for their own trading choices and risk management.
## 🔄 Version History
**v1.0** - Initial Release
- Pivot-based zone detection
- Volume and bar count accumulation
- Intrabar precision analysis
- Customizable filtering and styling
- Multiple area calculation methods
## 🤝 Credits & Inspiration
This indicator builds upon classical pivot point analysis while incorporating volume profile concepts to provide a more comprehensive view of support and resistance dynamics. The combination of time-at-price and volume analysis offers traders a quantitative approach to level assessment.
## 📝 Usage Notes
1. **Start with default settings** to understand how the indicator behaves on your preferred timeframe
2. **Adjust the pivot lookback** based on the timeframe and asset volatility
3. **Use filtering** to reduce noise and focus on significant zones
4. **Enable Intrabar Precision** for more accurate volume readings on lower timeframes
5. **Combine with price action** analysis for best results
## ⚡ Quick Start Guide
1. Add the indicator to your chart
2. Observe the red (resistance) and teal (support) zones forming at swing points
3. Watch the volume labels accumulate as price tests these levels
4. Note when lines turn dashed (level broken) vs solid (level holding)
5. Use higher volume zones as more significant levels for your analysis
**Remember**: No indicator is perfect. Always use multiple forms of analysis, practice proper risk management, and trade according to your own risk tolerance and strategy.
*If you find this indicator useful, please leave a rating and share your feedback. Your input helps improve future versions and assists other traders in the community.*
Versionshinweise
upgrade logicGeschütztes Skript
Dieses Script ist als Closed-Source veröffentlicht. Sie können es kostenlos und ohne Einschränkungen verwenden – erfahren Sie hier mehr.
I am nothing @shunya.trade
Haftungsausschluss
Die Informationen und Veröffentlichungen sind nicht als Finanz-, Anlage-, Handels- oder andere Arten von Ratschlägen oder Empfehlungen gedacht, die von TradingView bereitgestellt oder gebilligt werden, und stellen diese nicht dar. Lesen Sie mehr in den Nutzungsbedingungen.
Geschütztes Skript
Dieses Script ist als Closed-Source veröffentlicht. Sie können es kostenlos und ohne Einschränkungen verwenden – erfahren Sie hier mehr.
I am nothing @shunya.trade
Haftungsausschluss
Die Informationen und Veröffentlichungen sind nicht als Finanz-, Anlage-, Handels- oder andere Arten von Ratschlägen oder Empfehlungen gedacht, die von TradingView bereitgestellt oder gebilligt werden, und stellen diese nicht dar. Lesen Sie mehr in den Nutzungsbedingungen.