Aktualisiert
Prime Oscillators Pro [ChartPrime]
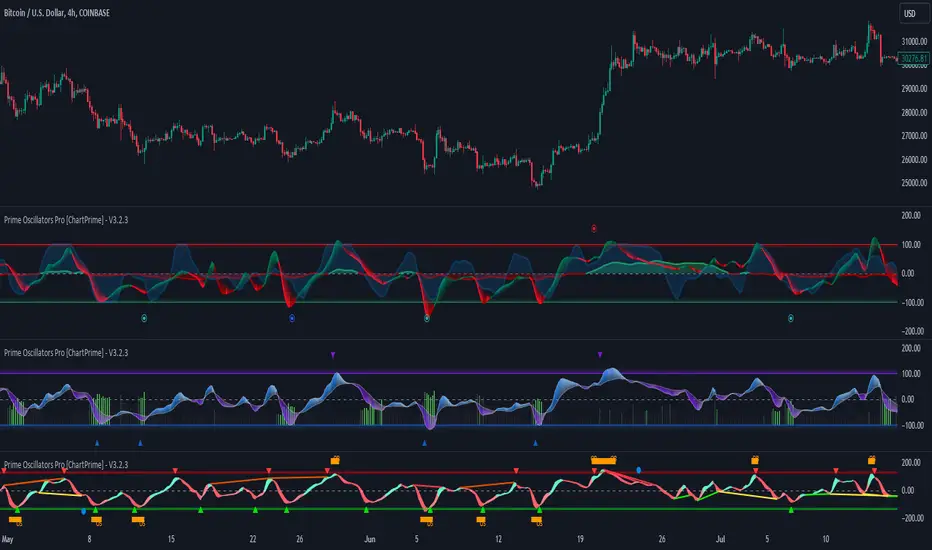
The Prime Oscillators Pro suite provides two unique oscillators that provide useful insights on divergences, overbought and over sold conditions, momentum reversals, confluence alerts, amongst a myriad of other features.
The Trend Fusion Oscillator
This oscillator uses an amalgamation of price and volume to give market participants useful insight into possible future price action. It is designed in the format of a classical oscillator to be recogniseable and have a easy learning curve.
The main features of the Trend Fusion Oscillator:
Trend mode: The price volume oscillator uses an adaptive calculation to signify when price is entering a downtrend or and uptrend. When the price volume oscillator intersects with the adaptive plot the color of the price volume band will change to signify an uptrend or a down trend. This is easy to interpret with red signifying a down trend and green signifying an uptrend.
Oversold or overbought conditions: A reasonable range calculation was implemented and normalized in order to extrapolate areas of overbought an oversold conditions.
Divergences: When the price volume oscillator ribbon peaks and valleys are diverging with price action a thin line will connect the two diverging peaks or vallyes to indicate to market participants that there is a higher probability of a reversal. Divergences can be used in a classical fashion for trading.
Areas of reversal: These signals incorporate an algorithm that takes the median length of the assets trends, average true range, price deviation, volatility, and gap conditions, to signal areas with high a probability of reversal.

Main Settings
Use cases
The Trend Fusion Oscillator can be used in a simple fashion using the red/green waves to idenfity market direction. Using the waves of the market, a trader can filter other indicators and build confluence. This can also apply to contrarian logic. Divergences and oversold/bought levels can be used in confluence with other factors such as classical SR or other user selected indicators.
The Prime oscillator
Reversal signals: These are in essence a contrarian signal predicting the reversal of the market and the oscillator.
The peak seekers are blue dots that analyse multiple indicators to deduce more accurate and confluence within divergences. Settings here are auto optimised depending on the user selected timeframe.
The momentum ribbon analyses market volatility and produces an actionable ribbon on which other calculations are deduced. When it twists it can indicate a shift in the trend.
Divergences are calculated so the indicator can catch the maxmimum number of divergences in order to avoid possible reversals being missed by the trader.

Risk Disclaimer
All content and developments created by ChartPrime are purely for informational & educational purposes only. Past performance does not guarantee future results.
The Trend Fusion Oscillator
This oscillator uses an amalgamation of price and volume to give market participants useful insight into possible future price action. It is designed in the format of a classical oscillator to be recogniseable and have a easy learning curve.
The main features of the Trend Fusion Oscillator:
Trend mode: The price volume oscillator uses an adaptive calculation to signify when price is entering a downtrend or and uptrend. When the price volume oscillator intersects with the adaptive plot the color of the price volume band will change to signify an uptrend or a down trend. This is easy to interpret with red signifying a down trend and green signifying an uptrend.
Oversold or overbought conditions: A reasonable range calculation was implemented and normalized in order to extrapolate areas of overbought an oversold conditions.
Divergences: When the price volume oscillator ribbon peaks and valleys are diverging with price action a thin line will connect the two diverging peaks or vallyes to indicate to market participants that there is a higher probability of a reversal. Divergences can be used in a classical fashion for trading.
Areas of reversal: These signals incorporate an algorithm that takes the median length of the assets trends, average true range, price deviation, volatility, and gap conditions, to signal areas with high a probability of reversal.
Main Settings
- Oscillator Mode: Select the desired type of oscillator via this dropdown
- Bands On/Off: Display deviation bands on the oscillators
- Bearish Divergences On/Off: Allow for toggling of bearish divergences
- Hidden Bearish Divergences On/Off: Allow for toggling of hidden bearish divergences
- Bullish Divergences On/Off: Allow for toggling of bullish divergences
- Hidden Bullish Divergences On/Off: Allow for toggling of bullish divergences
- Max disatance between points: Input to adjust the distances between divergences in terms of candles
Use cases
The Trend Fusion Oscillator can be used in a simple fashion using the red/green waves to idenfity market direction. Using the waves of the market, a trader can filter other indicators and build confluence. This can also apply to contrarian logic. Divergences and oversold/bought levels can be used in confluence with other factors such as classical SR or other user selected indicators.
The Prime oscillator
Reversal signals: These are in essence a contrarian signal predicting the reversal of the market and the oscillator.
The peak seekers are blue dots that analyse multiple indicators to deduce more accurate and confluence within divergences. Settings here are auto optimised depending on the user selected timeframe.
The momentum ribbon analyses market volatility and produces an actionable ribbon on which other calculations are deduced. When it twists it can indicate a shift in the trend.
Divergences are calculated so the indicator can catch the maxmimum number of divergences in order to avoid possible reversals being missed by the trader.
Risk Disclaimer
All content and developments created by ChartPrime are purely for informational & educational purposes only. Past performance does not guarantee future results.
Versionshinweise
Prime Oscillators Pro v3.1 - Added "Clean mode" for a simplistic stripped down version of the Chart prime Oscillator.
Added mid range reversal signals to the Trend fusion oscillator. (purple and blue)
Versionshinweise
New update for The ChartPrime Oscillators version V3.2. The following changes were made:- New oscillator mode added
- Clean mode removed
- New reversal signals added to trend fusion oscillator
- Divergence bug fixed on trend fusion oscillator
- Message boxes added to alert section to customize alert messages
Versionshinweise
Semantical fixVersionshinweise
Minor bug fixVersionshinweise
Upgraded to Version 3.2.1- Added MFI alert
- Message box Alerts are working properly now. Able to customize your alert message
Versionshinweise
Minor bug Versionshinweise
New updates for Prime Oscillators Pro:- Added MFI histogram on the Trend Fusion Oscillator to assist with identification of money flow in the market. Overbought and Oversold dots improved.
Versionshinweise
Minor Bug FixesVerfügbar im Paid Space
Dieser Indikator ist nur für ChartPrime Plus-Abonnenten verfügbar. Jetzt beitreten und Zugang zu diesem und weiteren Scripts von ChartPrime erhalten.
Haftungsausschluss
Die Informationen und Veröffentlichungen sind nicht als Finanz-, Anlage-, Handels- oder andere Arten von Ratschlägen oder Empfehlungen gedacht, die von TradingView bereitgestellt oder gebilligt werden, und stellen diese nicht dar. Lesen Sie mehr in den Nutzungsbedingungen.
Verfügbar im Paid Space
Dieser Indikator ist nur für ChartPrime Plus-Abonnenten verfügbar. Jetzt beitreten und Zugang zu diesem und weiteren Scripts von ChartPrime erhalten.
Haftungsausschluss
Die Informationen und Veröffentlichungen sind nicht als Finanz-, Anlage-, Handels- oder andere Arten von Ratschlägen oder Empfehlungen gedacht, die von TradingView bereitgestellt oder gebilligt werden, und stellen diese nicht dar. Lesen Sie mehr in den Nutzungsbedingungen.