OPEN-SOURCE SCRIPT
Current RSI vs Sector RSI Comparison

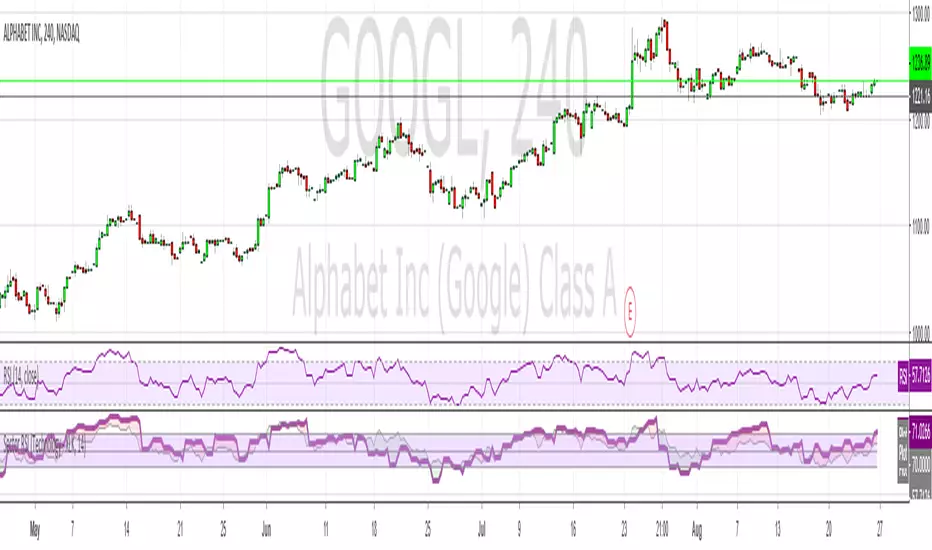
In the example above GOOGL's RSI is being compared against the RSI for XLK, the technology sector fund. The red and green areas make it easy to see if Google is under or overperforming relative to other tech stocks. I've included a normal RSI above it for comparison.
You can compare any stock to a sector, i.e. JP Morgan (JPM) versus the financial sector (XLF), or whatever your heart desires. All major sectors are selectable from a drop-down box and the output can also be visualised as a histogram too, much like a MACD.
You can compare any stock to a sector, i.e. JP Morgan (JPM) versus the financial sector (XLF), or whatever your heart desires. All major sectors are selectable from a drop-down box and the output can also be visualised as a histogram too, much like a MACD.
Open-source Skript
Ganz im Sinne von TradingView hat dieser Autor sein/ihr Script als Open-Source veröffentlicht. Auf diese Weise können nun auch andere Trader das Script rezensieren und die Funktionalität überprüfen. Vielen Dank an den Autor! Sie können das Script kostenlos verwenden, aber eine Wiederveröffentlichung des Codes unterliegt unseren Hausregeln.
Haftungsausschluss
Die Informationen und Veröffentlichungen sind nicht als Finanz-, Anlage-, Handels- oder andere Arten von Ratschlägen oder Empfehlungen gedacht, die von TradingView bereitgestellt oder gebilligt werden, und stellen diese nicht dar. Lesen Sie mehr in den Nutzungsbedingungen.