OPEN-SOURCE SCRIPT
Aktualisiert Asset Correlation
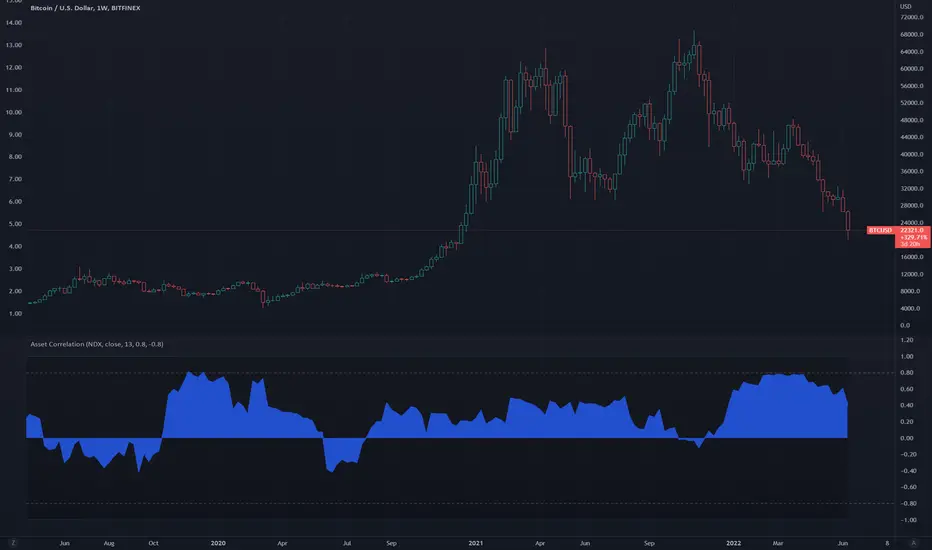
This indicator shows correlation strength between the source asset plotted in the main chart and a user-input asset in the indicator panel. For example, if the main chart panel is displaying BTCUSD and the correlation indicator is NDX, then the correlation strength is plotted as the relationship between the two. A strong positive correlation target is set at 0.80 but can be changed. A strong negative correlation target is set at -0.80 and can also be changed.
The indicator also has an option for a plot of the ta.correlation() function for a reference line.
The indicator also has an option for a plot of the ta.correlation() function for a reference line.
Versionshinweise
Changes as follows:- Fixed scale issue y axis for reference plot of ta.correlation(), which is hidden by default. As plots can’t be called from a local scope, the transparency of the plot is set to 100 when turned off which previously affected the y axis scale. Update sets ta.correlation() plot value to 0 and transparency to 100, when bShowTradingViewCorrelation is false.
Open-source Skript
Ganz im Sinne von TradingView hat dieser Autor sein/ihr Script als Open-Source veröffentlicht. Auf diese Weise können nun auch andere Trader das Script rezensieren und die Funktionalität überprüfen. Vielen Dank an den Autor! Sie können das Script kostenlos verwenden, aber eine Wiederveröffentlichung des Codes unterliegt unseren Hausregeln.
Haftungsausschluss
Die Informationen und Veröffentlichungen sind nicht als Finanz-, Anlage-, Handels- oder andere Arten von Ratschlägen oder Empfehlungen gedacht, die von TradingView bereitgestellt oder gebilligt werden, und stellen diese nicht dar. Lesen Sie mehr in den Nutzungsbedingungen.