PROTECTED SOURCE SCRIPT
Aktualisiert The Directional Cross Strategy

A simple chart-based strategy, which capitalizes on trend change.
Based on Azeez Mustapha's article featured in Stocks & Commodities Oct 2021 issue.
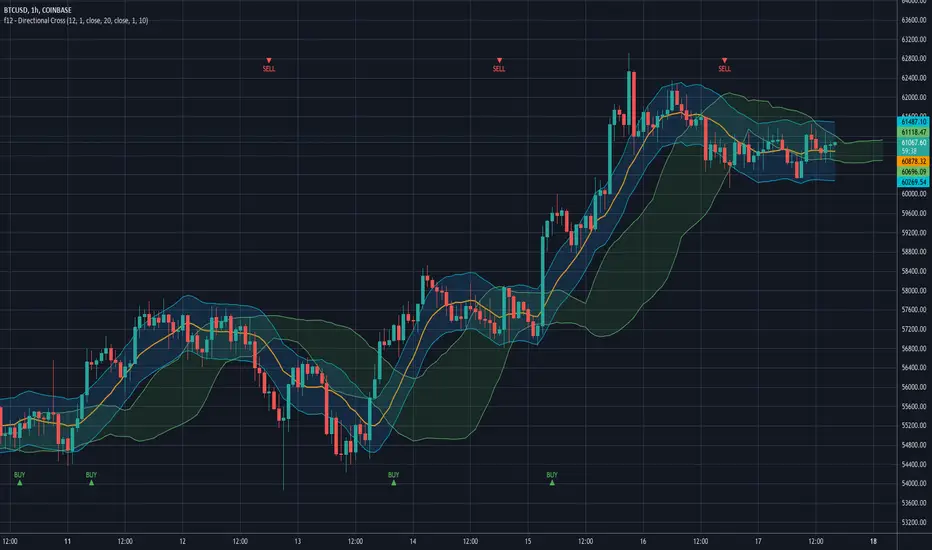
This indicator consists of three tools: a simple moving average (SMA), price envelopes, and Bollinger Bands.
Please note that this strategy only works in trending markets.
What is a trending market?
A trending market is one that is ascending with higher highs and higher lows or descending with lower highs and lower lows.
So, when the market is ranging it's not a good fit for this strategy. It is therefore advisable for the trader to stay out of the market when consolidation is noticed.
Usage of other tools in combination with this one is recommended to determine the market conditions.
Ok, so how to use this indicator:
The combination of the indicators used in this strategy displays BUY and SELL alerts.
When the lower line of the envelope on the chart would cross over the lower band of the Bollinger Bands, a BUY alert is displayed.
When the upper line of the envelope on the chart would cross down the upper band of the Bollinger Bands, a SELL alert is displayed.
As always, proper risk management should be followed.
Versionshinweise
Buy/Sell signals now coordinate with the BB offset.Geschütztes Skript
Dieses Script ist als Closed-Source veröffentlicht. Sie können es kostenlos und ohne Einschränkungen verwenden – erfahren Sie hier mehr.
Haftungsausschluss
Die Informationen und Veröffentlichungen sind nicht als Finanz-, Anlage-, Handels- oder andere Arten von Ratschlägen oder Empfehlungen gedacht, die von TradingView bereitgestellt oder gebilligt werden, und stellen diese nicht dar. Lesen Sie mehr in den Nutzungsbedingungen.
Geschütztes Skript
Dieses Script ist als Closed-Source veröffentlicht. Sie können es kostenlos und ohne Einschränkungen verwenden – erfahren Sie hier mehr.
Haftungsausschluss
Die Informationen und Veröffentlichungen sind nicht als Finanz-, Anlage-, Handels- oder andere Arten von Ratschlägen oder Empfehlungen gedacht, die von TradingView bereitgestellt oder gebilligt werden, und stellen diese nicht dar. Lesen Sie mehr in den Nutzungsbedingungen.