OPEN-SOURCE SCRIPT
EMA/SMA Cross with Levels
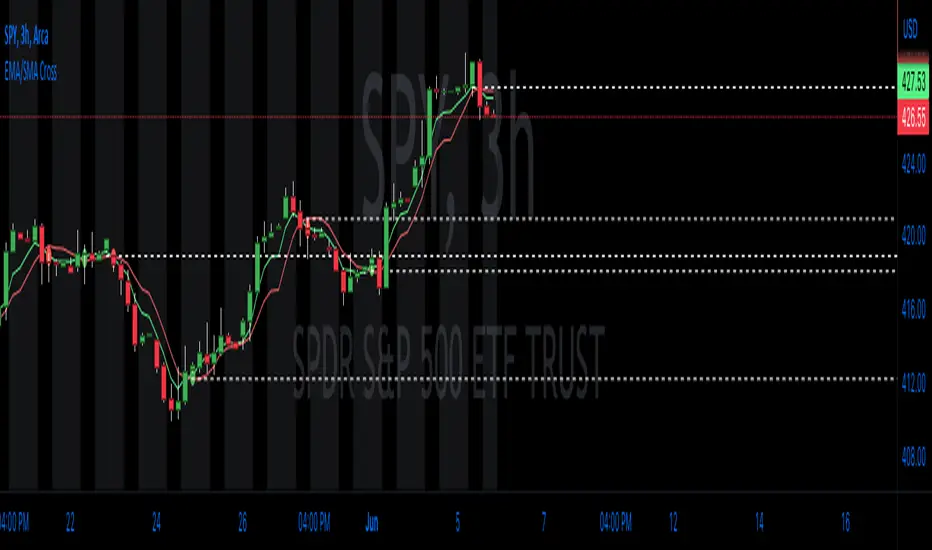
The EMA/SMA Cross indicator is a valuable trading tool designed to assist traders in identifying potential trend reversals or entry and exit points in the market. By plotting two moving averages, one based on the Exponential Moving Average (EMA) and the other on the Simple Moving Average (SMA), this indicator highlights the points at which these averages cross, signaling a potential change in the market trend. This straightforward yet powerful indicator follows the core principles of technical analysis, allowing traders to visualize key price levels that may influence future price action.
The underlying concept of this indicator revolves around the calculation and comparison of the short-term EMA and the long-term SMA. The EMA is a type of weighted moving average that gives more importance to recent price data, making it more responsive to new information. In contrast, the SMA assigns equal weight to all data points within a specified period, providing a smoother representation of price trends. By comparing these two averages, traders can gain insights into potential shifts in market sentiment and momentum.
When the short-term EMA crosses above the long-term SMA, it signals a possible bullish trend reversal, indicating that the recent price momentum is gaining strength. Conversely, when the short-term EMA crosses below the long-term SMA, it suggests a bearish trend reversal, implying that the recent price momentum is weakening. Traders can use these crossing points as potential entry or exit signals, depending on their trading strategy and risk tolerance.
A unique feature of this indicator is its ability to plot the crossing levels on the chart. When the short-term EMA crosses the long-term SMA, a dashed line is drawn horizontally at the level of the cross, emphasizing the significance of the price level. This line serves as a reference point for traders, helping them to identify potential support or resistance levels that may influence future price movements.
By plotting the crossing levels, the EMA/SMA Cross indicator offers traders an additional layer of information that can be used in their decision-making process. These levels can act as crucial points for stop-loss or take-profit orders, depending on the trader's strategy and risk tolerance. Additionally, they can serve as a basis for further technical analysis, such as the identification of chart patterns or the application of other technical indicators.
This indicator works best with trading methods that focus on capturing price reversals or breakouts. It is particularly useful for traders who employ trend-following or momentum-based strategies, as it helps them identify the optimal moments to enter or exit a trade. However, it's important to note that the EMA/SMA Cross indicator should be used in conjunction with other technical analysis tools and an understanding of the overall market context to make informed trading decisions.
When using the EMA/SMA Cross indicator on TradingView, users can customize the time frame, source, and length for both the short-term EMA and long-term SMA, as well as the number of recent crossing lines displayed on the chart. This flexibility allows traders to tailor the indicator to their specific trading style and preferences.
In summary, the EMA/SMA Cross indicator is an essential tool for traders looking to identify potential trend reversals or entry and exit points in the market. By comparing the short-term EMA and long-term SMA, this indicator provides valuable insights into shifts in market sentiment and momentum. It is best suited for trend-following and momentum-based trading strategies and should be used in combination with other technical analysis tools for optimal results.
Open-source Skript
Ganz im Sinne von TradingView hat dieser Autor sein/ihr Script als Open-Source veröffentlicht. Auf diese Weise können nun auch andere Trader das Script rezensieren und die Funktionalität überprüfen. Vielen Dank an den Autor! Sie können das Script kostenlos verwenden, aber eine Wiederveröffentlichung des Codes unterliegt unseren Hausregeln.
Haftungsausschluss
Die Informationen und Veröffentlichungen sind nicht als Finanz-, Anlage-, Handels- oder andere Arten von Ratschlägen oder Empfehlungen gedacht, die von TradingView bereitgestellt oder gebilligt werden, und stellen diese nicht dar. Lesen Sie mehr in den Nutzungsbedingungen.