PROTECTED SOURCE SCRIPT
Aktualisiert Proxy
Proxy Indicator
The Proxy indicator is a simplified version of the Larry Williams Proxy Index (LWPI), designed to identify potential overbought and oversold conditions in the market. It calculates a normalized value based on price momentum and volatility, helping traders spot reversal opportunities.
Features
Main Line: Displays the Proxy Index value with a customizable period (default: 8).
Configurable Levels: Five adjustable horizontal levels in the Style tab:
Sell Level 1 (default: 75, red, dotted, linewidth 1)
Sell Level 2 (default: 70, red, dotted, linewidth 1)
Middle Level (default: 50, gray, dashed, linewidth 1)
Buy Level 1 (default: 25, light green, dotted, linewidth 1)
Buy Level 2 (default: 20, light green, dotted, linewidth 1)
Alerts: Built-in alerts for crossovers and crossunders at the middle level (50).
Customization: Adjust the period in the Inputs tab and fine-tune level values, colors, and styles in the Style tab.
Usage
Use the indicator to identify overbought (Sell Levels) and oversold (Buy Levels) zones.
Set alerts to receive notifications when the Proxy Index crosses the middle level, signaling potential buy or sell opportunities.
Customize the levels in the Style tab to match your trading strategy.
Settings
Period: Adjust the lookback period for the calculation (default: 8).
Style Settings: Modify level values, colors, linewidths, and line styles (solid, dashed, dotted) directly in the Style tab.
This indicator is ideal for traders seeking a straightforward tool to gauge market momentum and potential reversals. Add it to your chart and customize it to fit your trading style!
Versionshinweise
Proxy Indicator - UpdateThe Proxy indicator has been updated with new default settings for improved usability:
Main Line: Now defaults to #00bcd4 (cyan) with a linewidth of 1.
Levels:
Sell Level 1: Set to 70 (previously 75), red (#ff0000), dotted, linewidth 1.
Sell Level 2: Set to 75 (previously 70), red (#ff0000), dotted, linewidth 1.
Buy Level 1: Set to 30 (previously 25), light green (#16e520), dotted, linewidth 1.
Buy Level 2: Set to 25 (previously 20), light green (#16e520), dotted, linewidth 1.
Middle Level: Unchanged at 50, gray, dashed, linewidth 1.
All levels remain fully customizable in the Style tab, and alerts for crossovers at the middle level (50) are still active. Adjust the period in the Inputs tab to suit your strategy.
Versionshinweise
Proxy Indicator - UpdateThe Proxy indicator has been updated with the following changes:
Middle 50 Level: Now defaults to #dbdbdb (light gray), dotted style, linewidth 1.
Moving Average: Added an EMA (default period: 5, white color #ffffff, linewidth 1) for trend confirmation.
Removed Alerts: All crossover alerts have been removed for a cleaner experience.
Customize the period and MA type in the Inputs tab, and adjust levels, colors, and styles in the Style tab to fit your trading strategy.
Versionshinweise
Proxy 2.0 Indicator - UpdateThe Proxy 2.0 indicator has been updated with the following enhancements:
Indicator Name: Updated to "Proxy 2.0" for clarity.
Main Line: Changed to #d03aea (magenta), linewidth 2, solid style.
EMA: Updated to #dbdbdb (light gray), linewidth 1, default period 9 (EMA).
New Levels: Added Intermediate Level 40 and 60, both with #3d3d3d (dark gray), linewidth 1, dotted style for subtle visibility.
Levels Updated:
Sell Level 1 (75): #2962ff (blue), linewidth 1, solid.
Sell Level 2 (70): #f23645 (red), linewidth 1, solid.
Central Level 50: #9c9c9c (gray), linewidth 1, dotted.
Buy Level 1 (30): #4caf50 (green), linewidth 1, solid.
Buy Level 2 (25): #2962ff (blue), linewidth 1, solid.
Zones: Sell Zone (70-75, #f23645, 10% opacity) and Buy Zone (30-25, #4caf50, 10% opacity) remain, configurable in the Style tab.
Customize periods in the Inputs tab and levels, lines, and zones in the Style tab to suit your trading strategy.
Versionshinweise
Proxy 2.0 Indicator - UpdateThe Proxy 2.0 indicator has been updated to align level lines and buy/sell zones with price action:
Level Lines: Switched to fixed values using plot for consistent display, with updated styles:
Sell Level 1 (75): #2962ff (blue), linewidth 1, solid.
Sell Level 2 (70): #f23645 (red), linewidth 1, solid.
Intermediate Level 60: #3d3d3d (dark gray), linewidth 1, solid.
Central Level 50: #808080 (gray), linewidth 1, solid.
Intermediate Level 40: #3d3d3d (dark gray), linewidth 1, solid.
Buy Level 1 (30): #4caf50 (green), linewidth 1, solid.
Buy Level 2 (25): #2962ff (blue), linewidth 1, solid.
Buy/Sell Zones: Maintained between 70-75 (#f23645, 10% opacity) and 30-25 (#4caf50, 10% opacity), configurable in the Style tab.
Main Line and EMA: Unchanged, with #d03aea (magenta), linewidth 2, solid for the main line, and #dbdbdb (light gray), linewidth 1, period 9 (EMA) for the moving average.
Customize periods in the Inputs tab and colors, linewidths, and styles in the Style tab to fit your trading strategy.
Versionshinweise
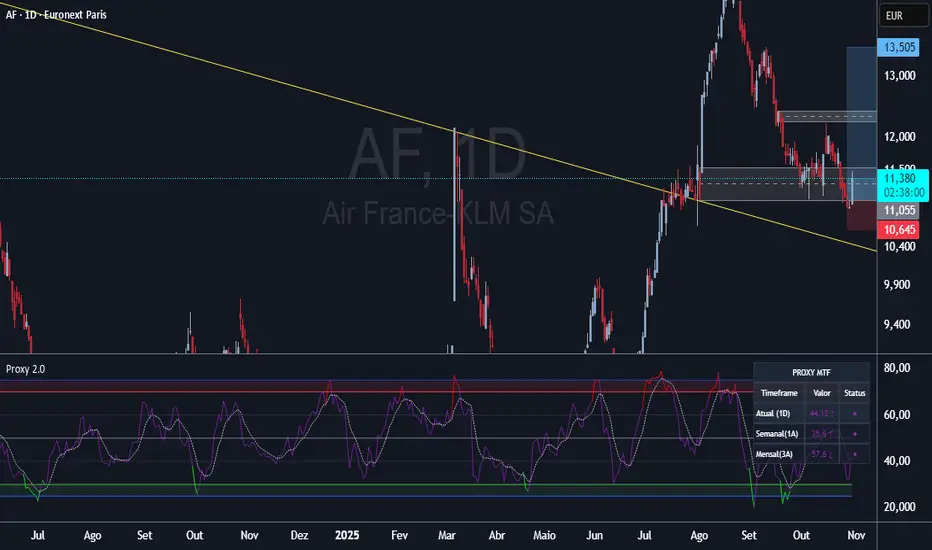
**Proxy 2.0 - Multi-Timeframe Update****New Features:**
**Multi-Timeframe Analysis**
- Custom timeframe selection for main indicator line - analyze any timeframe regardless of current chart
- Secondary MTF line with independent timeframe selection for comparative analysis
- Fully customizable visual settings (color, thickness, style) for secondary line
**Interactive MTF Table**
- Display up to 3 customizable timeframes simultaneously in a compact table
- Real-time values with color-coded status indicators (buy/sell/neutral zones)
- Trend arrows showing momentum direction for each timeframe
- Smart timeframe labels: Daily (6M), Weekly (1Y), Monthly (3Y) representing futures contract periods
- Adjustable table position and size
**Enhanced Visualization**
- Color-coded dots indicating zone status (green/purple/red)
- Organized settings with dedicated sections: Basic Settings, Moving Average Configuration, Secondary Line, and Informative Table
- All visual customizations accessible through Style tab
**Default Settings Optimized:**
- WMA (Weighted Moving Average) as default
- Improved color scheme for better visibility
- Table enabled by default for immediate multi-timeframe insights
Perfect for traders seeking institutional flow analysis across multiple timeframes, inspired by COT (Commitment of Traders) report logic.
Versionshinweise
**Proxy 2.0 - Compact Mode Update****New Feature: Compact Mode with Emojis**
Enhanced the Multi-Timeframe table with a new visual display option:
- **Compact Mode (Emojis)** - Enabled by default for quick visual analysis
- 🔴 Red circle: Overbought zone (value ≥ 70) - Expensive/Sell signal
- 🟢 Green circle: Oversold zone (value ≤ 30) - Cheap/Buy signal
- ● Purple circle: Neutral zone (value between 30-70) - Normal range
- **Expanded Mode** - Toggle off for detailed text descriptions
- Displays "Expensive", "Cheap", or "Normal" status labels
- Maintains color-coded visualization (red/green/purple)
The compact mode provides instant visual feedback across all three timeframes, making it easier to spot institutional positioning at a glance. Perfect for traders who prefer quick emoji-based signals over text descriptions.
Both modes include trend arrows (↑↓) showing momentum direction for each timeframe.
Versionshinweise
Thought for 1sHere's a brief update text for TradingView publication:---
**Proxy 2.0 - Smart Table Update**
**New Feature: Automatic Redundancy Detection**
The Multi-Timeframe table now intelligently adapts to your current chart timeframe:
- **Smart Display Logic** - Automatically hides redundant information
- When viewing a Daily chart, the "Daily (6M)" row is hidden from the MTF table
- When viewing a Weekly chart, the "Weekly (1Y)" row is automatically removed
- Only displays timeframes different from your current chart view
- **Dynamic Table Sizing** - Table adjusts automatically based on visible rows
- Shows 1-3 timeframes depending on redundancy detection
- Cleaner interface with no duplicate information
- More efficient use of chart space
- **Normalized Timeframe Matching** - Recognizes equivalent formats
- Handles variations like "1D" = "D1" = "D"
- Works with all standard timeframe formats (minutes, hours, days, weeks, months)
This update ensures you always see relevant multi-timeframe analysis without cluttering your chart with redundant data from your current viewing timeframe.
Versionshinweise
Thought for 4sHere's a brief update text for TradingView publication:---
**Update: Enhanced Multi-Timeframe Table with Professional Design**
**New Features:**
• **Current Timeframe Display** - Added dedicated row at the top showing the chart's current timeframe value and status for quick reference and comparison with MTF data
• **Dual Theme Support** - Premium color palettes optimized for both dark and light chart backgrounds, ensuring excellent readability in any environment
• **Customizable Colors** - Optional color customization for values and status symbols across all zones (buy/sell/normal), giving users full control over visual preferences
• **Signal Strength Indicator** - Enhanced status symbols now differentiate between strong and weak signals:
- Strong Buy (≤20): ▲▲
- Weak Buy (21-30): ▲
- Strong Sell (≥80): ▼▼
- Weak Sell (70-79): ▼
- Neutral (30-70): ●
• **Momentum Arrows** - Visual indicators (↑↓→) show whether values are rising, falling, or stable compared to the previous bar
• **Professional Design** - Refined color scheme with clear visual hierarchy, optimized spacing, and elegant borders for improved readability and professional appearance
Versionshinweise
**Update: Improved Table Readability****UI Enhancement:**
• **Optimized Column Layout** - Momentum arrows (↑↓→) now display alongside values in the "Valor" column instead of the "Status" column, creating clearer visual hierarchy and reducing confusion. Each column now has a distinct purpose:
- **Valor**: Shows the numeric value with its directional movement
- **Status**: Displays zone indicator and signal strength (▲▲/▲/●/▼/▼▼)
This refinement makes the table more intuitive and easier to read at a glance, improving decision-making speed for traders.
Versionshinweise
**Update: Dynamic Color System for Secondary Line****New Features:**
• **Dynamic Color Zones for Secondary Line** - The secondary line now features automatic color changes based on market zones, matching the main line's logic:
- Green when in buy zone (≤30)
- Purple in neutral zone (30-70)
- Red when in sell zone (≥70)
• **Customizable Color Palette** - Three independent color inputs in the Style tab allow full customization of the secondary line's appearance across all zones
• **Enhanced Visual Hierarchy** - Secondary line uses brighter, more luminous color tones to create clear visual distinction from the main line while maintaining the same color logic:
- Main Line: Base colors (darker/standard tones)
- Secondary Line: Lighter/brighter variations
• **Improved Style Tab Organization** - Secondary line options now appear directly below the main line settings for intuitive configuration workflow
This update makes multi-timeframe analysis more intuitive by applying consistent color logic across both indicator lines while maintaining clear visual differentiation.
Geschütztes Skript
Dieses Script ist als Closed-Source veröffentlicht. Sie können es kostenlos und ohne Einschränkungen verwenden – erfahren Sie hier mehr.
Haftungsausschluss
Die Informationen und Veröffentlichungen sind nicht als Finanz-, Anlage-, Handels- oder andere Arten von Ratschlägen oder Empfehlungen gedacht, die von TradingView bereitgestellt oder gebilligt werden, und stellen diese nicht dar. Lesen Sie mehr in den Nutzungsbedingungen.