PROTECTED SOURCE SCRIPT
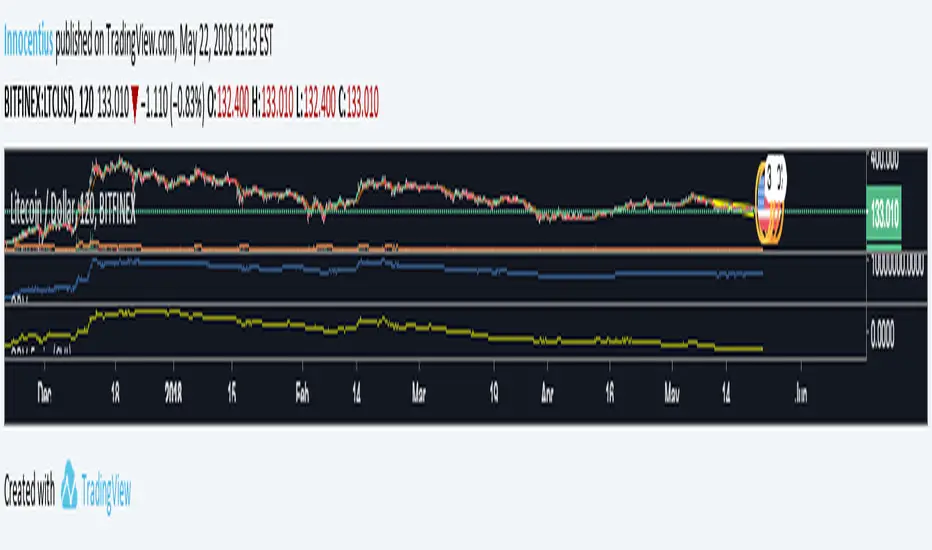
On Balance Volume locked 5min (CVI)

OBV shows the cumulation of the volume bars. All the volume in a green bar gets added to the obv and all the volume in a red bar gets subtracted. At a higher timeframe this can be misleading, because it filters out a lot of volume. This indicator locks the obv at 5 minutes, giving more information about the total amount of added and subtracted volume.
Geschütztes Skript
Dieses Script ist als Closed-Source veröffentlicht. Sie können es kostenlos und ohne Einschränkungen verwenden – erfahren Sie hier mehr.
Haftungsausschluss
Die Informationen und Veröffentlichungen sind nicht als Finanz-, Anlage-, Handels- oder andere Arten von Ratschlägen oder Empfehlungen gedacht, die von TradingView bereitgestellt oder gebilligt werden, und stellen diese nicht dar. Lesen Sie mehr in den Nutzungsbedingungen.