PROTECTED SOURCE SCRIPT
Aktualisiert SMC + EMAs & Liquidity Lines by Bruno Machado
SMC & Liquidity Zones
Full Description (for copy and paste):
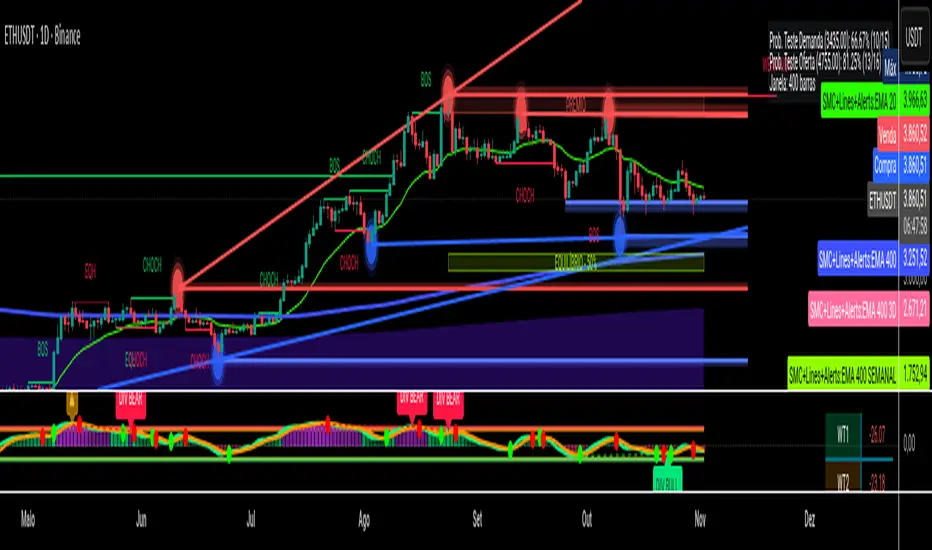
This “All-in-One” indicator was designed to be the only tool you need on your chart, combining two of the most effective methodologies in modern trading: Smart Money Concepts (SMC) and Automated Liquidity Analysis.
Its purpose is to provide a complete view of market structure and key zones of interest, eliminating the need for multiple indicators and keeping your chart clean and objective.
Main Features:
Module 1: Smart Money Analysis (SMC) & EMAs
Structure Mapping (BOS & CHOCH): Automatically identifies Breaks of Structure (BOS) and Changes of Character (CHOCH), both for the Swing (major) and Internal (minor) structures.
Premium and Discount Zones: Dynamically plots the Premium, Equilibrium (50%), and Discount zones based on the latest swing move, visually showing the best areas for buying and selling.
Strong and Weak Highs/Lows: Highlights strong and weak highs and lows, an essential SMC concept to understand trend continuation or reversal.
Multiple EMAs and Clouds: Includes EMAs (20, 50, 100, 200, 400) and a visual cloud between the 20 and 50 EMAs. It also plots higher timeframe EMAs (Weekly and 3D) for a macro view of the trend.
Integrated Alerts: Set alerts for all structure break events (BOS/CHOCH) so you never miss an important market move.
Module 2: Liquidity Zones and Trendlines
Automatic Liquidity Zones: Detects and draws Supply and Demand Zones based on recent pivots. The zone thickness is calculated using the ATR, adapting to market volatility.
Volume Within Zones: Calculates the accumulated trading volume inside each liquidity zone to help validate its strength.
Dynamic Trendlines: Automatically plots trendlines (support and resistance) by connecting the latest pivots, showing the order flow direction.
Retest Probability Calculation: A unique function that calculates and displays the historical probability of a new liquidity zone being retested within a custom time window.
How to Use:
The strength of this indicator lies in confluence. Use the signals to confirm your analysis.
Trend Confirmation: Use EMAs and the Swing Structure (BOS) to define the main trend.
Entry Hunting: After a bullish BOS, wait for the price to return to a Demand Liquidity Zone (support) located within the Discount Zone to look for buy entries. The opposite applies for sell setups.
Reversal Signals: A CHOCH appearing within a major timeframe liquidity zone can signal an excellent reversal opportunity.
This script turns your chart into a clear map of the battle between buyers and sellers, showing where liquidity is located and where price is most likely to react.
Credits and Collaboration:
This indicator is the result of combining two powerful logics. Credit for the concept and unification goes to Bruno Machado.
For contact and collaboration: brunomachado788@gmail.com
Full Description (for copy and paste):
This “All-in-One” indicator was designed to be the only tool you need on your chart, combining two of the most effective methodologies in modern trading: Smart Money Concepts (SMC) and Automated Liquidity Analysis.
Its purpose is to provide a complete view of market structure and key zones of interest, eliminating the need for multiple indicators and keeping your chart clean and objective.
Main Features:
Module 1: Smart Money Analysis (SMC) & EMAs
Structure Mapping (BOS & CHOCH): Automatically identifies Breaks of Structure (BOS) and Changes of Character (CHOCH), both for the Swing (major) and Internal (minor) structures.
Premium and Discount Zones: Dynamically plots the Premium, Equilibrium (50%), and Discount zones based on the latest swing move, visually showing the best areas for buying and selling.
Strong and Weak Highs/Lows: Highlights strong and weak highs and lows, an essential SMC concept to understand trend continuation or reversal.
Multiple EMAs and Clouds: Includes EMAs (20, 50, 100, 200, 400) and a visual cloud between the 20 and 50 EMAs. It also plots higher timeframe EMAs (Weekly and 3D) for a macro view of the trend.
Integrated Alerts: Set alerts for all structure break events (BOS/CHOCH) so you never miss an important market move.
Module 2: Liquidity Zones and Trendlines
Automatic Liquidity Zones: Detects and draws Supply and Demand Zones based on recent pivots. The zone thickness is calculated using the ATR, adapting to market volatility.
Volume Within Zones: Calculates the accumulated trading volume inside each liquidity zone to help validate its strength.
Dynamic Trendlines: Automatically plots trendlines (support and resistance) by connecting the latest pivots, showing the order flow direction.
Retest Probability Calculation: A unique function that calculates and displays the historical probability of a new liquidity zone being retested within a custom time window.
How to Use:
The strength of this indicator lies in confluence. Use the signals to confirm your analysis.
Trend Confirmation: Use EMAs and the Swing Structure (BOS) to define the main trend.
Entry Hunting: After a bullish BOS, wait for the price to return to a Demand Liquidity Zone (support) located within the Discount Zone to look for buy entries. The opposite applies for sell setups.
Reversal Signals: A CHOCH appearing within a major timeframe liquidity zone can signal an excellent reversal opportunity.
This script turns your chart into a clear map of the battle between buyers and sellers, showing where liquidity is located and where price is most likely to react.
Credits and Collaboration:
This indicator is the result of combining two powerful logics. Credit for the concept and unification goes to Bruno Machado.
For contact and collaboration: brunomachado788@gmail.com
Versionshinweise
SMC & Liquidity ZonesThis “All-in-One” indicator was designed to be the only tool you need on your chart, combining two of the most effective methodologies in modern trading: Smart Money Concepts (SMC) and Automated Liquidity Analysis.
Its purpose is to provide a complete view of market structure and key zones of interest, eliminating the need for multiple indicators and keeping your chart clean and objective.
Main Features:
Module 1: Smart Money Analysis (SMC) & EMAs
Structure Mapping (BOS & CHOCH): Automatically identifies Breaks of Structure (BOS) and Changes of Character (CHOCH), both for the Swing (major) and Internal (minor) structures.
Premium and Discount Zones: Dynamically plots the Premium, Equilibrium (50%), and Discount zones based on the latest swing move, visually showing the best areas for buying and selling.
Strong and Weak Highs/Lows: Highlights strong and weak highs and lows, an essential SMC concept to understand trend continuation or reversal.
Multiple EMAs and Clouds: Includes EMAs (20, 50, 100, 200, 400) and a visual cloud between the 20 and 50 EMAs. It also plots higher timeframe EMAs (Weekly and 3D) for a macro view of the trend.
Integrated Alerts: Set alerts for all structure break events (BOS/CHOCH) so you never miss an important market move.
Module 2: Liquidity Zones and Trendlines
Automatic Liquidity Zones: Detects and draws Supply and Demand Zones based on recent pivots. The zone thickness is calculated using the ATR, adapting to market volatility.
Volume Within Zones: Calculates the accumulated trading volume inside each liquidity zone to help validate its strength.
Dynamic Trendlines: Automatically plots trendlines (support and resistance) by connecting the latest pivots, showing the order flow direction.
Retest Probability Calculation: A unique function that calculates and displays the historical probability of a new liquidity zone being retested within a custom time window.
How to Use:
The strength of this indicator lies in confluence. Use the signals to confirm your analysis.
Trend Confirmation: Use EMAs and the Swing Structure (BOS) to define the main trend.
Entry Hunting: After a bullish BOS, wait for the price to return to a Demand Liquidity Zone (support) located within the Discount Zone to look for buy entries. The opposite applies for sell setups.
Reversal Signals: A CHOCH appearing within a major timeframe liquidity zone can signal an excellent reversal opportunity.
This script turns your chart into a clear map of the battle between buyers and sellers, showing where liquidity is located and where price is most likely to react.
Credits and Collaboration:
This indicator is the result of combining two powerful logics. Credit for the concept and unification goes to Bruno Machado.
For contact and collaboration: brunomachado788@gmail.com
Geschütztes Skript
Dieses Script ist als Closed-Source veröffentlicht. Sie können es kostenlos und ohne Einschränkungen verwenden – erfahren Sie hier mehr.
Haftungsausschluss
Die Informationen und Veröffentlichungen sind nicht als Finanz-, Anlage-, Handels- oder andere Arten von Ratschlägen oder Empfehlungen gedacht, die von TradingView bereitgestellt oder gebilligt werden, und stellen diese nicht dar. Lesen Sie mehr in den Nutzungsbedingungen.