PROTECTED SOURCE SCRIPT
Aktualisiert Sessions and Market Structure Highs and Lows
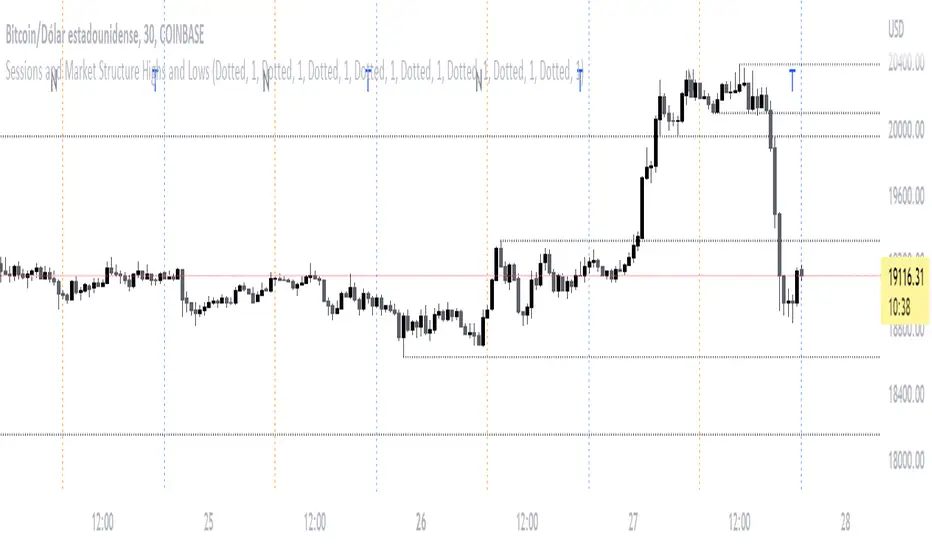
This Indicator has the purpose that traders can see the opening of the different sessions on the chart in a clean and visually pleasing way.
By adding the script to your chart, vertical lines will automatically appear at the specific opening hours of each session
What schedules are used by the Script?
Keep in mind that the style of the line can be modified from the indicator settings, by the way in case you do not want to see the main letter of each session on the chart, you can also deactivate it from the settings
Also, in a very entertaining way, you will be able to see the Highs and Lows of the corresponding temporalities.
By adding the script to your chart, vertical lines will automatically appear at the specific opening hours of each session
What schedules are used by the Script?
- The New York session starts at 07:30 GMT and its line will be represented by the color Orange
- Then for the London session the start is plotted at 03:30 GMT with the Gray line
- And finally the Asia/Tokyo session at 19:00 GMT with its Blue color line
Keep in mind that the style of the line can be modified from the indicator settings, by the way in case you do not want to see the main letter of each session on the chart, you can also deactivate it from the settings
Also, in a very entertaining way, you will be able to see the Highs and Lows of the corresponding temporalities.
Versionshinweise
You can define open sessions timeGeschütztes Skript
Dieses Script ist als Closed-Source veröffentlicht. Sie können es kostenlos und ohne Einschränkungen verwenden – erfahren Sie hier mehr.
Haftungsausschluss
Die Informationen und Veröffentlichungen sind nicht als Finanz-, Anlage-, Handels- oder andere Arten von Ratschlägen oder Empfehlungen gedacht, die von TradingView bereitgestellt oder gebilligt werden, und stellen diese nicht dar. Lesen Sie mehr in den Nutzungsbedingungen.
Geschütztes Skript
Dieses Script ist als Closed-Source veröffentlicht. Sie können es kostenlos und ohne Einschränkungen verwenden – erfahren Sie hier mehr.
Haftungsausschluss
Die Informationen und Veröffentlichungen sind nicht als Finanz-, Anlage-, Handels- oder andere Arten von Ratschlägen oder Empfehlungen gedacht, die von TradingView bereitgestellt oder gebilligt werden, und stellen diese nicht dar. Lesen Sie mehr in den Nutzungsbedingungen.