PROTECTED SOURCE SCRIPT
Aktualisiert Volume Wizard - Omkar

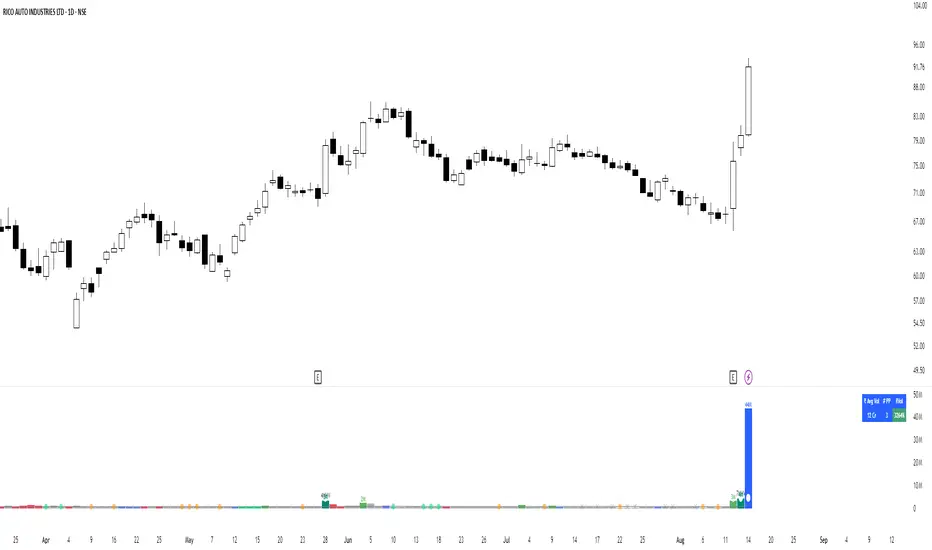
- Volume bars on up days will be in 'silver' colour.
- Volume bars on down days will be in 'grey' colour.
- The volume bar will ‘be red’ in colour if the latest close is below the previous close and the volume is more than the average volume.
- A green circle will be plotted if the current candle volume is the least in the last 20 days.
- The volume bar will be ‘blue’ in colour if the current candle volume is more than the highest volume of the down day in the last 5 days (5-day Pocket Pivot).
- The volume bar will be ‘green’ in colour if the current candle volume is more than the highest volume of the down day in the last 10 days (10-day Pocket Pivot).
- The volume bar will be ‘lime’ in colour if the current candle volume is more than the highest volume of the down day in the last 20 days (20-day Pocket Pivot).
- The volume bar will be ‘teal’ in colour if the current candle volume is highest in the last 3 months.
- The volume bar will be ‘aqua’ in colour if the current candle volume is highest in the last 1 year.
- If the current volume is the lowest in the last 22 days, a tiny yellow circle will be plotted on the volume average line on daily and weekly timeframe only.
- If the current volume is more than three times the average volume and the close is in the top half of the candle, a diamond will be plotted at the top of the volume bar on a daily and weekly timeframe only.
- Average volume days and Pivot lookback period can be modified.
- The table shows the average turnover, the number of pocket pivots in the last ‘n’ days and the up-down ratio.
- The table position can be changed.
Volume Wizard - Omkar indicator provides me with insights, allowing me to make informed trading decisions, and identify potential trends.
It's my go-to companion for navigating the financial markets with confidence.
Add it to your favourites and start using it right away.
Happy trading!
Versionshinweise
- MA Type
- RVol
Added 'Relative Volume' in percentage in the Table.
Versionshinweise
- Added 'Relative Volume' in the table.
Versionshinweise
- Added 2-week volume contraction.
- Added text for High volumes.
- Rectified RVol.
Versionshinweise
- Bull Snort
Added Bull Snort in volume bars.
Versionshinweise
- Bug fixes
Versionshinweise
- Added Average volume & RVol for IPOs
Versionshinweise
- Bug fixes
Geschütztes Skript
Dieses Script ist als Closed-Source veröffentlicht. Sie können es kostenlos und ohne Einschränkungen verwenden – erfahren Sie hier mehr.
Charts speak!
Haftungsausschluss
Die Informationen und Veröffentlichungen sind nicht als Finanz-, Anlage-, Handels- oder andere Arten von Ratschlägen oder Empfehlungen gedacht, die von TradingView bereitgestellt oder gebilligt werden, und stellen diese nicht dar. Lesen Sie mehr in den Nutzungsbedingungen.