PROTECTED SOURCE SCRIPT
Aktualisiert Ultimate Volume (UV) Supply/Demand Absorption [cI8DH]

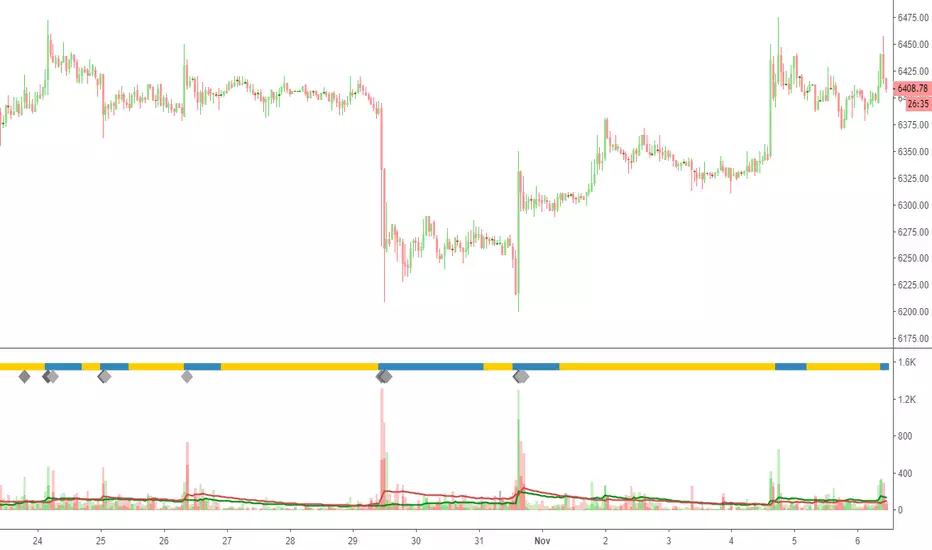
This is a variant of my ADV indicator which adds low/high volume trend, supply/demand absorption detection and separate buy/sell volume moving averages. When aggregation is set to cumulative, it can replicate my ADL indicator as well. It shows both regular volume bars and the accumulated/distributed (A/D) portions of volume.
Green line shows buy volume/accumulation and red line shows sell volume/distribution. This can help with assessing buy/sell pressure (read "why invent a new indicator" for more info about why this is more accurate than CMF, MFI, OBV and Williams AD for this purpose).
Volume trend shows high and low volume periods in blue and yellow respectively. This could help with avoiding over-trading during low market activity periods.

Supply/demand absorption is shown at the top (below volume trend). It shows that market is resisting the trend which could most often lead to sideways or minor/major trend change. Darker colors show stronger resistance. This feature is configured with two parameters that might require tuning depending on the asset and time frame.

The equation to calculate accumulation/distribution (A/D) is elegant and intuitive. It calculates candle body to candle height ratio and multiplies it by volume: volume*(close-open)/(high-low). This is the building block of my three other indicators ADMF, ADP and ADL (UMF includes all these three indicators). The volume bars has two shades of green and red. The dark shade shows amount of A/D and the light shade shows total volume (what you see on a regular volume indicator).

When money volume is enabled, volume is multiplied by price. As you can see in the chart below, trade volume in terms of USD was growing over the past years while it has not made a new ATH in terms of the instrument (BTC).

Notes
- Uncheck "Money Volume" for Bitmex or any other exchange that shows volume in terms of money.
- Smooth MA length N = EMA length 2*N-1
- Combined tickers, e.g. (COINBASE:BTCUSD+BITSTAMP:BTCUSD+KRAKEN:XBTUSD)/3, can mitigate inconsistency issues between different exchanges (I recommend not mixing USD and USDT pairs together)
Here is a TL;DR list of my indicators to save you some time from looking at my obsolete indicators.

Green line shows buy volume/accumulation and red line shows sell volume/distribution. This can help with assessing buy/sell pressure (read "why invent a new indicator" for more info about why this is more accurate than CMF, MFI, OBV and Williams AD for this purpose).
Volume trend shows high and low volume periods in blue and yellow respectively. This could help with avoiding over-trading during low market activity periods.
Supply/demand absorption is shown at the top (below volume trend). It shows that market is resisting the trend which could most often lead to sideways or minor/major trend change. Darker colors show stronger resistance. This feature is configured with two parameters that might require tuning depending on the asset and time frame.
The equation to calculate accumulation/distribution (A/D) is elegant and intuitive. It calculates candle body to candle height ratio and multiplies it by volume: volume*(close-open)/(high-low). This is the building block of my three other indicators ADMF, ADP and ADL (UMF includes all these three indicators). The volume bars has two shades of green and red. The dark shade shows amount of A/D and the light shade shows total volume (what you see on a regular volume indicator).
When money volume is enabled, volume is multiplied by price. As you can see in the chart below, trade volume in terms of USD was growing over the past years while it has not made a new ATH in terms of the instrument (BTC).
Notes
- Uncheck "Money Volume" for Bitmex or any other exchange that shows volume in terms of money.
- Smooth MA length N = EMA length 2*N-1
- Combined tickers, e.g. (COINBASE:BTCUSD+BITSTAMP:BTCUSD+KRAKEN:XBTUSD)/3, can mitigate inconsistency issues between different exchanges (I recommend not mixing USD and USDT pairs together)
Here is a TL;DR list of my indicators to save you some time from looking at my obsolete indicators.

Versionshinweise
- Geschütztes Skript
Dieses Script ist als Closed-Source veröffentlicht. Sie können es kostenlos und ohne Einschränkungen verwenden – erfahren Sie hier mehr.
Haftungsausschluss
Die Informationen und Veröffentlichungen sind nicht als Finanz-, Anlage-, Handels- oder andere Arten von Ratschlägen oder Empfehlungen gedacht, die von TradingView bereitgestellt oder gebilligt werden, und stellen diese nicht dar. Lesen Sie mehr in den Nutzungsbedingungen.
Geschütztes Skript
Dieses Script ist als Closed-Source veröffentlicht. Sie können es kostenlos und ohne Einschränkungen verwenden – erfahren Sie hier mehr.
Haftungsausschluss
Die Informationen und Veröffentlichungen sind nicht als Finanz-, Anlage-, Handels- oder andere Arten von Ratschlägen oder Empfehlungen gedacht, die von TradingView bereitgestellt oder gebilligt werden, und stellen diese nicht dar. Lesen Sie mehr in den Nutzungsbedingungen.
