OPEN-SOURCE SCRIPT
Aktualisiert Market Info Bar Charts - Was Bored
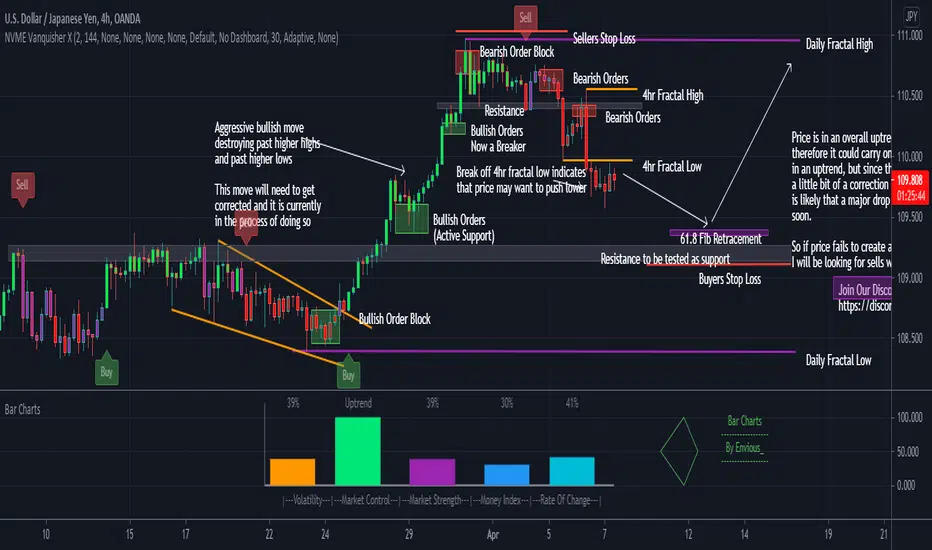
Simple script in a form of a bar chart showing you some market information ;)
Versionshinweise
Added Information:Volatility is calculated using the relative volatility index
Market Control is calculated using exponential moving averages and the percent of the strength is based on how many bars the market goes on in that trend.
Market Strength is calculated with RSI and will change colour if it is overbought (red) or oversold (green)
Money Index is calculated with Money Flow Index
Rate of Change is calculated with ROC but it cannot go to a negative number and the max it can go up to is a 100%.
You can change anything in this market info bar chart indicator if you need :)
Versionshinweise
Changed the font-size so that it suits the bar charts on different time-frames (still isn't fully accurate due to the limitation of font-sizes on pinescript)Open-source Skript
Ganz im Sinne von TradingView hat dieser Autor sein/ihr Script als Open-Source veröffentlicht. Auf diese Weise können nun auch andere Trader das Script rezensieren und die Funktionalität überprüfen. Vielen Dank an den Autor! Sie können das Script kostenlos verwenden, aber eine Wiederveröffentlichung des Codes unterliegt unseren Hausregeln.
Haftungsausschluss
Die Informationen und Veröffentlichungen sind nicht als Finanz-, Anlage-, Handels- oder andere Arten von Ratschlägen oder Empfehlungen gedacht, die von TradingView bereitgestellt oder gebilligt werden, und stellen diese nicht dar. Lesen Sie mehr in den Nutzungsbedingungen.
Open-source Skript
Ganz im Sinne von TradingView hat dieser Autor sein/ihr Script als Open-Source veröffentlicht. Auf diese Weise können nun auch andere Trader das Script rezensieren und die Funktionalität überprüfen. Vielen Dank an den Autor! Sie können das Script kostenlos verwenden, aber eine Wiederveröffentlichung des Codes unterliegt unseren Hausregeln.
Haftungsausschluss
Die Informationen und Veröffentlichungen sind nicht als Finanz-, Anlage-, Handels- oder andere Arten von Ratschlägen oder Empfehlungen gedacht, die von TradingView bereitgestellt oder gebilligt werden, und stellen diese nicht dar. Lesen Sie mehr in den Nutzungsbedingungen.