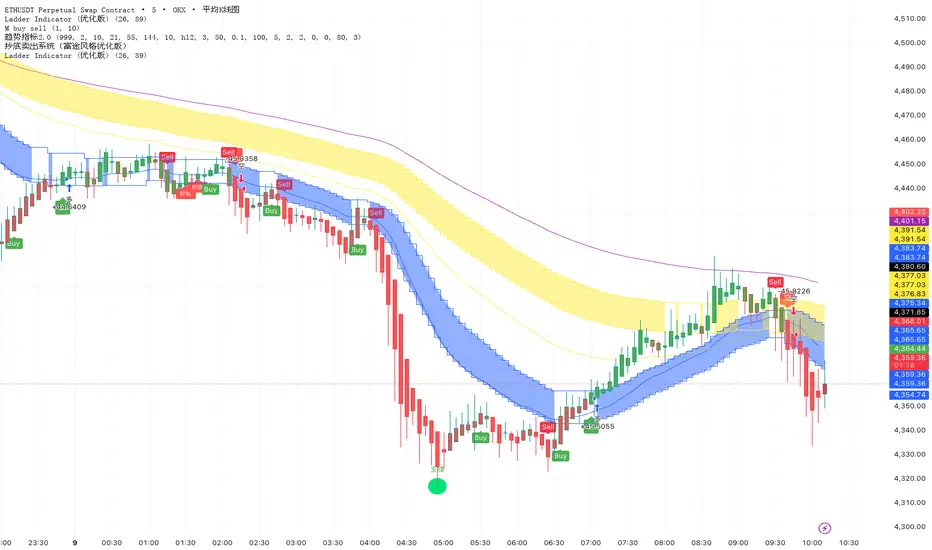
Ladder Indicator (优化版)
indicator("Ladder Indicator (优化版)", overlay=true)
// 参数
n1 = input.int(26, title="短周期N1")
n2 = input.int(89, title="长周期N2")
// 计算短周期EMA
ema_high_n1 = ta.ema(high, n1)
ema_low_n1 = ta.ema(low, n1)
// 计算长周期EMA
ema_high_n2 = ta.ema(high, n2)
ema_low_n2 = ta.ema(low, n2)
// 定义颜色
color_short = color.blue
color_long = color.yellow
// 短周期条件:收盘在两条线之间
short_band_top = close > ema_high_n1 ? ema_high_n1 : close < ema_low_n1 ? ema_low_n1 : na
short_band_bottom = close > ema_high_n1 ? ema_low_n1 : close < ema_low_n1 ? ema_high_n1 : na
// 长周期条件:收盘在两条线之间
long_band_top = close > ema_high_n2 ? ema_high_n2 : close < ema_low_n2 ? ema_low_n2 : na
long_band_bottom = close > ema_high_n2 ? ema_low_n2 : close < ema_low_n2 ? ema_high_n2 : na
// 绘制短周期梯子(蓝色带)
plot1 = plot(short_band_top, color=color_short, style=plot.style_stepline, linewidth=1)
plot2 = plot(short_band_bottom, color=color_short, style=plot.style_stepline, linewidth=1)
fill(plot1, plot2, color=color_short, transp=70)
// 绘制长周期梯子(黄色带)
plot3 = plot(long_band_top, color=color_long, style=plot.style_stepline, linewidth=1)
plot4 = plot(long_band_bottom, color=color_long, style=plot.style_stepline, linewidth=1)
fill(plot3, plot4, color=color_long, transp=70)
// 绘制K线
plotcandle(open, high, low, close)
Skript nur auf Einladung
Ausschließlich Nutzer mit einer Erlaubnis des Autors können Zugriff auf dieses Script erhalten. Sie müssen diese Genehmigung bei dem Autor beantragen. Dies umfasst üblicherweise auch eine Zahlung. Wenn Sie mehr erfahren möchten, dann sehen Sie sich unten die Anweisungen des Autors an oder kontaktieren Sie zijing0592 direkt.
TradingView empfiehlt NICHT, für die Nutzung eines Scripts zu bezahlen, wenn Sie den Autor nicht als vertrauenswürdig halten und verstehen, wie das Script funktioniert. Sie können außerdem auch kostenlose Open-Source-Alternativen in unseren Community-Scripts finden.
Hinweise des Autors
Haftungsausschluss
Skript nur auf Einladung
Ausschließlich Nutzer mit einer Erlaubnis des Autors können Zugriff auf dieses Script erhalten. Sie müssen diese Genehmigung bei dem Autor beantragen. Dies umfasst üblicherweise auch eine Zahlung. Wenn Sie mehr erfahren möchten, dann sehen Sie sich unten die Anweisungen des Autors an oder kontaktieren Sie zijing0592 direkt.
TradingView empfiehlt NICHT, für die Nutzung eines Scripts zu bezahlen, wenn Sie den Autor nicht als vertrauenswürdig halten und verstehen, wie das Script funktioniert. Sie können außerdem auch kostenlose Open-Source-Alternativen in unseren Community-Scripts finden.