PROTECTED SOURCE SCRIPT
Volume Profile - Previous Day Levels

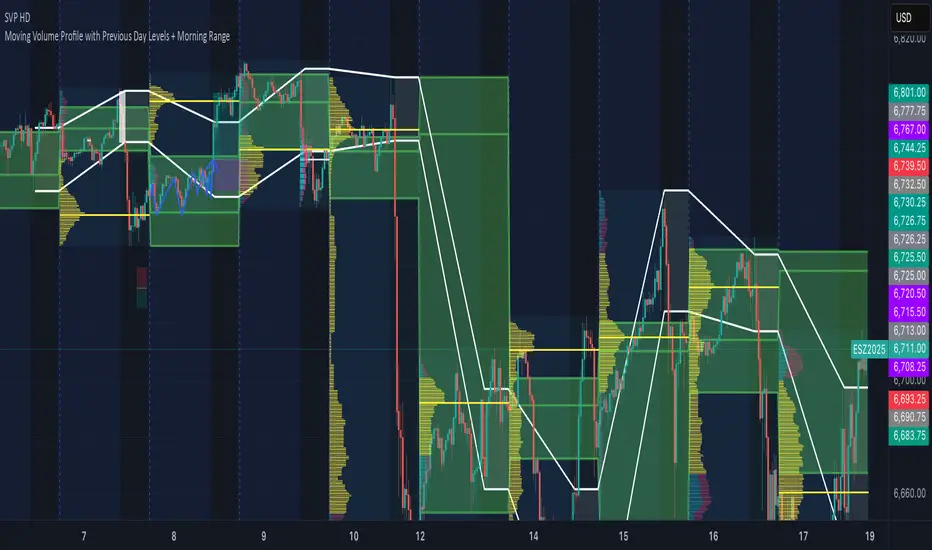
The green lines and area represent previous day Value Area. The values are not completely identical to Trading View default levels because of difference in calculation.
The white lines represent the min-max prices during the initial balance (9:30 to 10:30 EST). The diagnoal lines cannot be removed unfortunately.
You can also see same day evolving Valuea area and POC for momentum analysis.
The white lines represent the min-max prices during the initial balance (9:30 to 10:30 EST). The diagnoal lines cannot be removed unfortunately.
You can also see same day evolving Valuea area and POC for momentum analysis.
Geschütztes Skript
Dieses Script ist als Closed-Source veröffentlicht. Sie können es kostenlos und ohne Einschränkungen verwenden – erfahren Sie hier mehr.
Haftungsausschluss
Die Informationen und Veröffentlichungen sind nicht als Finanz-, Anlage-, Handels- oder andere Arten von Ratschlägen oder Empfehlungen gedacht, die von TradingView bereitgestellt oder gebilligt werden, und stellen diese nicht dar. Lesen Sie mehr in den Nutzungsbedingungen.