PROTECTED SOURCE SCRIPT
Wave Rider [BreakoutOrFakeout]

Wave Rider [BreakoutOrFakeout]
What It Does
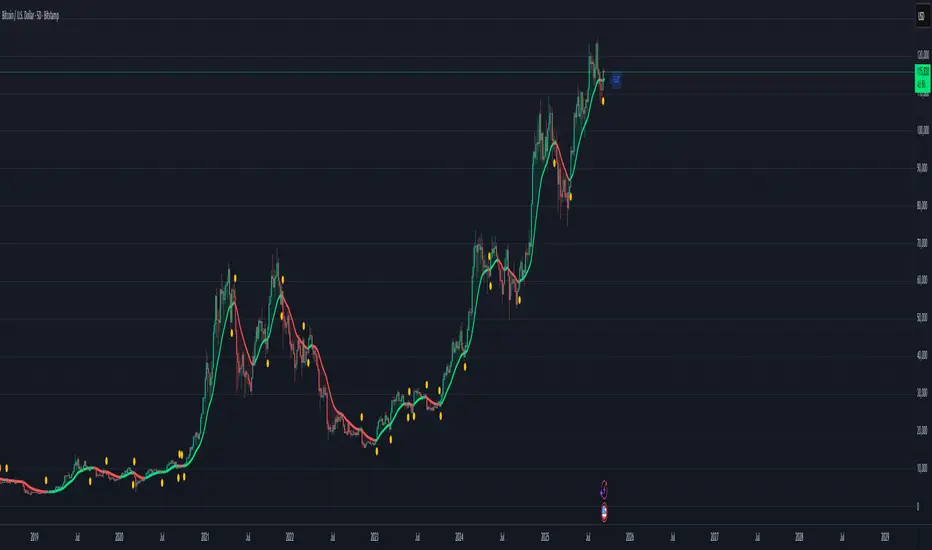
Creates an ultra-smooth trend wave that flows through price action, instantly revealing market direction and momentum strength through elegant visual design. The wave dynamically adapts its color intensity based on trend strength, making it easy to spot high-probability trading opportunities.
Key Features
🌊 Silky Smooth Wave
Double-smoothed calculation eliminates noise
Flows naturally through price action
Adjustable period and smoothing levels
🎨 Dynamic Color Flow
Bright colors = Strong momentum
Faded colors = Weakening trend
Smooth transitions show trend evolution
📊 Optional Ribbon Depth
1-5 translucent layers create visual depth
Shows trend consistency across periods
Beautiful flowing water effect
⚡ Smart Signals
Yellow dots mark potential turning points
Price/wave crossovers for entries
Wave angle analysis (flat/rising/steep)
✨ Clean Design
Minimal chart clutter
Optional candle coloring
Adjustable visual elements
How to Use
Trend Following: Trade in direction of wave color (green up, red down)
Entry Timing: Enter when price crosses above/below wave with momentum
Exit Signals: Watch for yellow dots indicating potential reversals
Momentum Gauge: Bright colors = stay in trade, fading = consider exit
Visual Guide
🟢 Green Wave = Uptrend (brighter = stronger)
🔴 Red Wave = Downtrend (brighter = stronger)
🔵 Blue Wave = Neutral/consolidating
🟡 Yellow Dots = Potential turning points
🌊 Ribbon = Multi-layer trend visualization
Settings
Core
Wave Period (5-50): Main trend sensitivity
Extra Smoothing (1-10): Additional noise reduction
Wave Offset: Shift wave forward/backward
Visual
Toggle wave, ribbon, signals, candle coloring
Adjust thickness, layers, transparency
Why Wave Rider?
Unlike choppy indicators that whipsaw in volatile markets, Wave Rider's double-smoothing creates a flowing trend line that filters out noise while remaining responsive to real moves. The visual design makes trend strength obvious at a glance - no interpretation needed.
Perfect for:
Trend traders wanting clear directional bias
Scalpers needing smooth entry/exit levels
Beginners learning trend-following concepts
Anyone wanting cleaner, more aesthetic charts
Trading Tips
✅ Best in trending markets - ride the wave
✅ Combine with volume for confirmation
✅ Use multiple timeframes for context
✅ Bright colors = high confidence signals
✅ Let the wave guide position sizing
⚠️ DISCLAIMER: For educational purposes only. Trading involves substantial risk of loss. Past performance does not guarantee future results. Always use proper risk management and never risk more than you can afford to lose.
Geschütztes Skript
Dieses Script ist als Closed-Source veröffentlicht. Sie können es kostenlos und ohne Einschränkungen verwenden – erfahren Sie hier mehr.
Haftungsausschluss
Die Informationen und Veröffentlichungen sind nicht als Finanz-, Anlage-, Handels- oder andere Arten von Ratschlägen oder Empfehlungen gedacht, die von TradingView bereitgestellt oder gebilligt werden, und stellen diese nicht dar. Lesen Sie mehr in den Nutzungsbedingungen.