LQ Zones
══════════════════════════════════════════
OVERVIEW
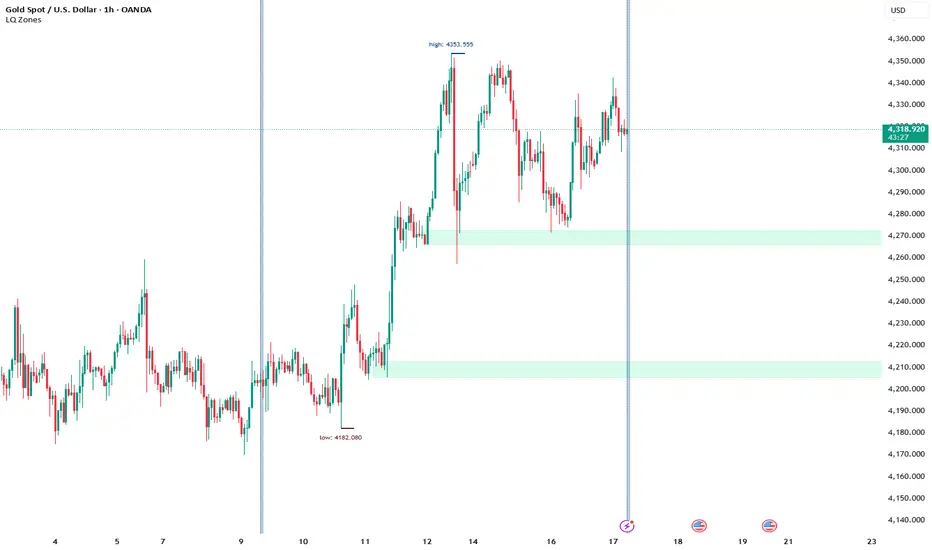
LQ Zones identifies potential liquidity accumulation areas by analyzing volume distribution across price levels within a user-defined time range. The indicator helps traders locate zones where concentrated trading activity may have occurred.
CORE CONCEPT
The indicator is based on Volume Profile analysis – examining how trading volume is distributed across different price levels rather than across time. Within your selected range, the algorithm identifies price levels where volume has concentrated and flags these as potential zones of interest.
WHAT MAKES IT DIFFERENT
Unlike standard Volume Profile indicators that display the entire distribution, LQ Zones focuses specifically on detecting stable accumulation areas – price levels where volume concentration persisted across multiple bars. These persistent zones are then filtered based on whether subsequent price action has revisited them.
HOW IT WORKS (General Logic)
1. User defines a time range using start and end boundaries
2. The indicator determines whether the selected range was predominantly bullish or bearish
3. Volume distribution across price levels is analyzed within that range
4. Zones where volume accumulated consistently are identified
5. Only zones that remain untested (not revisited by price) are displayed
ZONE PLACEMENT
- Bullish context: Zones appear below the main activity area
- Bearish context: Zones appear above the main activity area
This placement logic is based on the principle that accumulated positions create potential reaction areas in the direction opposite to their formation.
SETTINGS
- Start/End Time – Defines analysis boundaries
- Merge Distance – Combines nearby zones (in points)
- Show HH/LL – Displays range structure markers
- Zone Colors – Visual customization for bullish/bearish zones
LIMITATIONS
- Provides potential zones only – no stop-loss or take-profit levels
- No buy/sell signals generated
- Zone validity depends on user's time range selection
- Historical zones do not guarantee future price reactions
DISCLAIMER
This is an analytical tool for educational purposes. It does not constitute trading advice. Past performance does not indicate future results. Always use proper risk management.
Skript nur auf Einladung
Ausschließlich Nutzer mit einer Erlaubnis des Autors können Zugriff auf dieses Script erhalten. Sie müssen diese Genehmigung bei dem Autor beantragen. Dies umfasst üblicherweise auch eine Zahlung. Wenn Sie mehr erfahren möchten, dann sehen Sie sich unten die Anweisungen des Autors an oder kontaktieren Sie Atabaki direkt.
TradingView empfiehlt NICHT, für die Nutzung eines Scripts zu bezahlen, wenn Sie den Autor nicht als vertrauenswürdig halten und verstehen, wie das Script funktioniert. Sie können außerdem auch kostenlose Open-Source-Alternativen in unseren Community-Scripts finden.
Hinweise des Autors
Haftungsausschluss
Skript nur auf Einladung
Ausschließlich Nutzer mit einer Erlaubnis des Autors können Zugriff auf dieses Script erhalten. Sie müssen diese Genehmigung bei dem Autor beantragen. Dies umfasst üblicherweise auch eine Zahlung. Wenn Sie mehr erfahren möchten, dann sehen Sie sich unten die Anweisungen des Autors an oder kontaktieren Sie Atabaki direkt.
TradingView empfiehlt NICHT, für die Nutzung eines Scripts zu bezahlen, wenn Sie den Autor nicht als vertrauenswürdig halten und verstehen, wie das Script funktioniert. Sie können außerdem auch kostenlose Open-Source-Alternativen in unseren Community-Scripts finden.