hinton_map
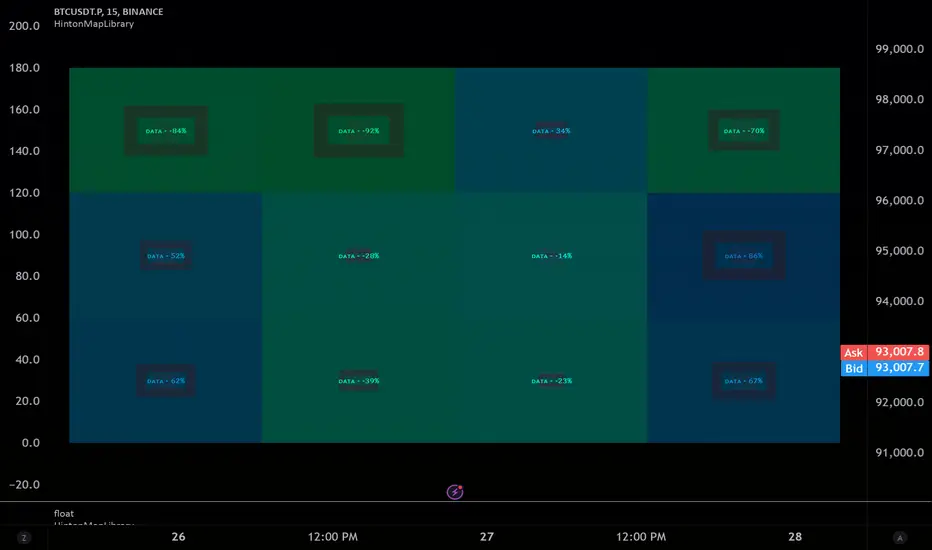
This library provides functions to create and display a Hinton Map visualization. A Hinton map uses squares to represent the magnitude and direction of values in a matrix. This library allows you to display multiple ticker/timeframe/indicator combinations on a single chart, using color/boxsize/bnordersize to represent the values used. The values must be from -1.0 to 1.0 in value. 3 different values can be input per square.
Example Usage:
The example below demonstrates how to create a Hinton Map for two symbols (AAPL and MSFT) across three timeframes (1 minute, 5 minutes, and 1 day).
█ createHintonUnit
Creates a Hinton unit.
•fillValue
Value to determine the fill color hue.
Type: float
Default Value: 0.0
•borderValue
Value to determine the border color hue and width.
Type: float
Default Value: 0.0
•innerValue
Value to determine the inner box color hue.
Type: float
Default Value: 0.0
•boxText
Text to display in the inner box.
Type: dv.DisplayValue
Default Value: na
•tooltipText
Tooltip text for the inner box.
Type: dv.DisplayValue
Default Value: na
Returns: HintonUnit
█ initHintonData
Initializes Hinton map data structure.
•rows
Number of rows.
Type: int
•columns
Number of columns.
Type: int
Returns: HintonData
█ drawHintonMap
Draws a Hinton map.
•hintonData
Hinton map data.
Type: HintonData
•unitSize
Size of each unit in bars.
Type: int
Default Value: 10
•borderWidth
Base width of the inner box border.
Type: int
Default Value: 5
•plusHue
Hue value for positive values (0-360).
Type: float
Default Value: 180
•minusHue
Hue value for negative values (0-360).
Type: float
Default Value: -30
█ HintonUnit
Data for a Hinton unit.
•fillValue
Value to determine the fill color hue.
Type: float
•borderValue
Value to determine the border color hue and width.
Type: float
•innerValue
Value to determine the inner box color hue.
Type: float
•boxText
Text to display in the inner box.
Type: dv.DisplayValue
•tooltipText
Tooltip text for the inner box.
Type: dv.DisplayValue
█ HintonData
Structure to store Hinton map data.
•unitMatrix
Matrix of Hinton units.
Type: matrix<HintonUnit>
•lineMatrix
Matrix of lines.
Type: matrix<line>
•labelMatrix
Matrix of labels.
Type: matrix<label>
•boxMatrix
Matrix of boxes.
Type: matrix<box>
•fillMatrix
Matrix of line fills.
Type: matrix<linefill>
Pine Bibliothek
Ganz im Sinne von TradingView hat dieser Autor seinen/ihren Pine Code als Open-Source-Bibliothek veröffentlicht. Auf diese Weise können nun auch andere Pine-Programmierer aus unserer Community den Code verwenden. Vielen Dank an den Autor! Sie können diese Bibliothek privat oder in anderen Open-Source-Veröffentlichungen verwenden. Die Nutzung dieses Codes in einer Veröffentlichung wird in unseren Hausregeln reguliert.
Haftungsausschluss
Pine Bibliothek
Ganz im Sinne von TradingView hat dieser Autor seinen/ihren Pine Code als Open-Source-Bibliothek veröffentlicht. Auf diese Weise können nun auch andere Pine-Programmierer aus unserer Community den Code verwenden. Vielen Dank an den Autor! Sie können diese Bibliothek privat oder in anderen Open-Source-Veröffentlichungen verwenden. Die Nutzung dieses Codes in einer Veröffentlichung wird in unseren Hausregeln reguliert.