PROTECTED SOURCE SCRIPT
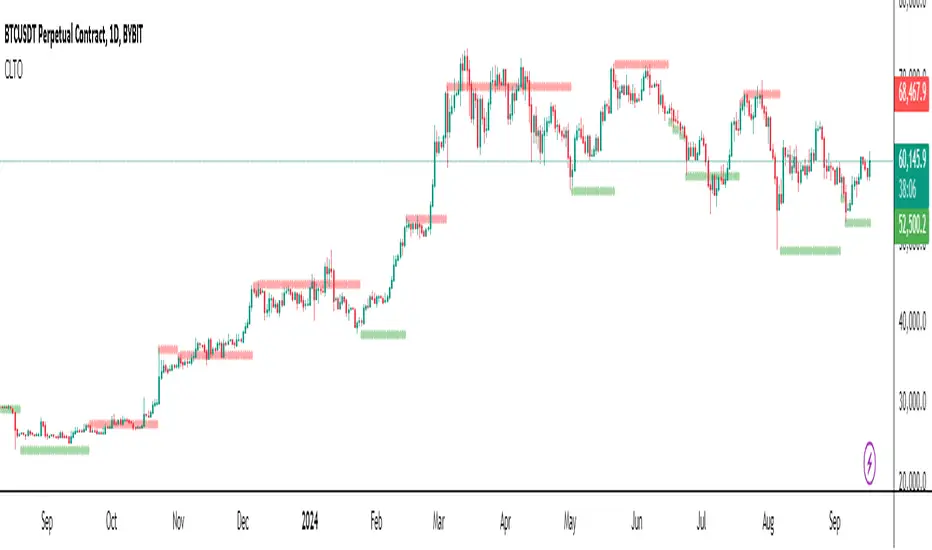
Chronos Trend Level Oracle (CTLO)

The Chronos Trend Level Oracle (CTLO) is a powerful technical analysis tool designed to identify significant trend levels that can act as support and resistance, helping traders navigate market trends and potential reversal points.
Key Components:
Setup Identification:
CTLO Support Level:
CTLO Resistance Level:
Level Persistence:
Visual Representation:
How to Use the CTLO:
Trend Identification:
Support and Resistance:
Breakouts and Breakdowns:
Trend Continuation:
Reversal Anticipation:
Multiple Timeframe Analysis:
Combine with Price Action:
Risk Management:
Key Components:
Setup Identification:
- Bullish Setup: 9 consecutive closes lower than the close 4 bars earlier.
- Bearish Setup: 9 consecutive closes higher than the close 4 bars earlier.
CTLO Support Level:
- Established when a Bullish Setup completes.
- Represents the lowest low of the CTLO Period (default 9 bars) preceding the Setup completion.
CTLO Resistance Level:
- Established when a Bearish Setup completes.
- Represents the highest high of the CTLO Period (default 9 bars) preceding the Setup completion.
Level Persistence:
- A CTLO level remains active until an opposite Setup completes.
- When a new Setup completes, it clears the opposite level.
Visual Representation:
- Support levels are displayed as green circles.
- Resistance levels are displayed as red circles.
- Both use translucency for better chart visibility.
How to Use the CTLO:
Trend Identification:
- The presence of a CTLO Support level suggests an underlying bullish trend.
- The presence of a CTLO Resistance level suggests an underlying bearish trend.
- The absence of either level indicates a possible trend transition or consolidation.
Support and Resistance:
- Use CTLO levels as potential support (green) or resistance (red) areas.
- These levels often act as price reaction points where bounces or rejections may occur.
Breakouts and Breakdowns:
- A decisive close above a CTLO Resistance level could signal a bullish breakout.
- A decisive close below a CTLO Support level could signal a bearish breakdown.
- Use the optional alerts to be notified of these events.
Trend Continuation:
- Price respecting a CTLO Support level can be seen as bullish, suggesting potential long entries.
- Price respecting a CTLO Resistance level can be seen as bearish, suggesting potential short entries.
Reversal Anticipation:
- As price approaches a CTLO level, watch for signs of reversal (e.g., candlestick patterns, divergences).
- Failed breakouts/breakdowns at CTLO levels can lead to strong moves in the opposite direction.
Multiple Timeframe Analysis:
- Apply CTLO on different timeframes for a more comprehensive market view.
- Higher timeframe CTLO levels often carry more significance.
Combine with Price Action:
- Look for candlestick patterns or chart formations near CTLO levels for higher probability setups.
- Double tops/bottoms or other reversal patterns at CTLO levels can be particularly significant.
Risk Management:
- Use CTLO levels to set stop-loss orders or profit targets.
- For breakout trades, consider using the CTLO level as a new stop-loss after the breakout occurs.
Geschütztes Skript
Dieses Script ist als Closed-Source veröffentlicht. Sie können es kostenlos und ohne Einschränkungen verwenden – erfahren Sie hier mehr.
Haftungsausschluss
Die Informationen und Veröffentlichungen sind nicht als Finanz-, Anlage-, Handels- oder andere Arten von Ratschlägen oder Empfehlungen gedacht, die von TradingView bereitgestellt oder gebilligt werden, und stellen diese nicht dar. Lesen Sie mehr in den Nutzungsbedingungen.