PROTECTED SOURCE SCRIPT
Sen Channel Lite
Sen Channel Lite
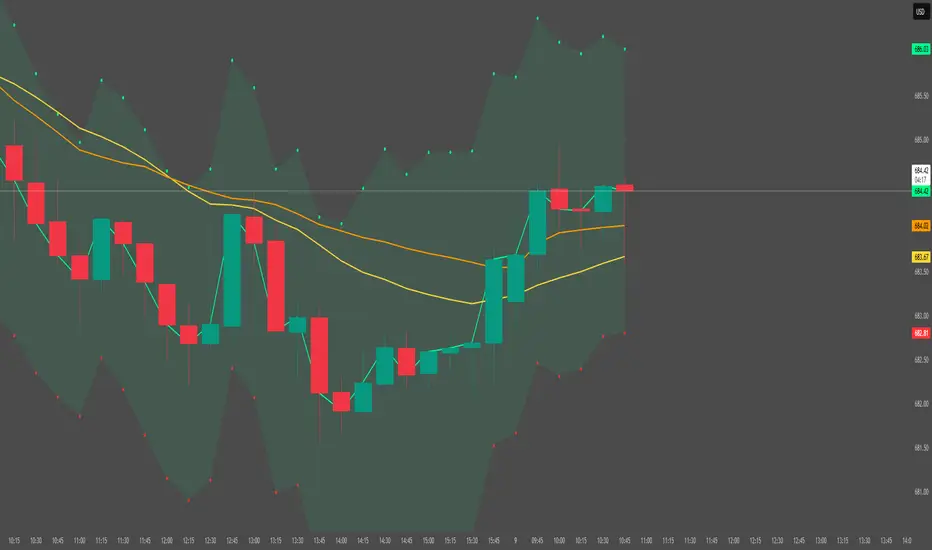
Sen Channel Lite calculates a robust, median-based regression channel using the Theil–Sen slope method. This visual tool helps traders identify trend direction and potential breakout zones in real time.
Key Features
Dynamic Trend Line: The median-based regression line adapts to price movement, providing a central reference for trend direction.
Upper and Lower Bands: Automatically updated bands highlight potential breakout or reversal areas.
Breakout Markers: Optional triangles indicate when price crosses above the upper band or below the lower band.
Midline (EMA/SMA): Toggleable trend line for additional context on price direction.
VWAP Anchor: Optional VWAP plot to visualize volume-weighted average price levels.
Customizable Inputs:
Lookback Period for slope calculation
Band Multiplier to adjust sensitivity
Option to use Standard Deviation or ATR for band width
Midline type, length, and color
VWAP visibility and color
Channel cloud transparency
How to Read Signals (Educational Use Only):
Trend Context: The midline provides a reference for general trend direction. Price above the midline suggests bullish bias; below indicates bearish bias.
Breakouts:
Triangle up → price crossed above the upper band; potential strong move upward.
Triangle down → price crossed below the lower band; potential strong move downward.
Channel Interpretation:
Price near the upper band → market may be overextended.
Price near the lower band → market may be oversold.
Price moving within the channel → trend is balanced; use additional analysis for direction.
VWAP Context: Compare price to VWAP for intraday support/resistance insights.
Usage Notes:
Fully visual tool; no trading or financial advice.
All calculations are protected to preserve intellectual property.
Results reflect real-time calculations; no repainting.
Suitable for intraday to daily timeframes.
Important: This script is published as protected/closed-source to safeguard GammaBulldog intellectual property.
Geschütztes Skript
Dieses Script ist als Closed-Source veröffentlicht. Sie können es kostenlos und ohne Einschränkungen verwenden – erfahren Sie hier mehr.
Haftungsausschluss
Die Informationen und Veröffentlichungen sind nicht als Finanz-, Anlage-, Handels- oder andere Arten von Ratschlägen oder Empfehlungen gedacht, die von TradingView bereitgestellt oder gebilligt werden, und stellen diese nicht dar. Lesen Sie mehr in den Nutzungsbedingungen.