OPEN-SOURCE SCRIPT
Momentum Madness (AKA: Moms Mad)

The "Momentum Madness" indicator is a customizable technical analysis tool designed for TradingView. It aims to help traders assess price momentum and make informed trading decisions. Below is a description of how this indicator works:
Indicator Title and Settings:
The indicator is titled "Momentum Madness" with a short title "Moms Mad."
Users can customize various settings to tailor the indicator to their preferences.
Input Parameters:
Traders can set the lengths (periods) for four different momentum calculations (len1, len2, len3, len4).
They can specify a lookback period for trend direction determination.
Users can choose from three smoothing types (RMA, SMA, EMA) and set the smoothing length (smoothLength).
The indicator offers options to adjust momentum calculations based on volume (useVolumeWeight), RSI (useRSIAdjustment), and MACD (useMACDAdjustment).
If the trend filter is enabled (useTrendFilter), the indicator considers whether the price is above the 200-period SMA.
Traders can incorporate Bollinger Bands adjustments (useBBAdjustment) and set the Bollinger Bands length (bbLength).
A volatility adjustment can be applied (useVolatilityAdjustment), using the Average True Range (ATR) with a specified length (atrLength).
Smoothing Function:
The indicator offers three smoothing options: RMA, SMA, and EMA, allowing users to select their preferred method for smoothing price data.
Momentum Calculations:
The indicator calculates four different momentum values (mom1, mom2, mom3, mom4) by subtracting the current price from historical prices based on the specified lengths.
Enhancement Features:
Users can enhance momentum calculations through volume weighting, RSI adjustment, MACD adjustment, trend filtering, Bollinger Bands adjustment, and volatility adjustment, depending on their preferences.
Trend Direction Detection:
The indicator identifies the trend direction based on the comparison of the current momentum (mom4Smooth) with a momentum value from a specified lookback period. It determines whether the trend is bullish (green), bearish (red), or neutral (no change).
Plots:
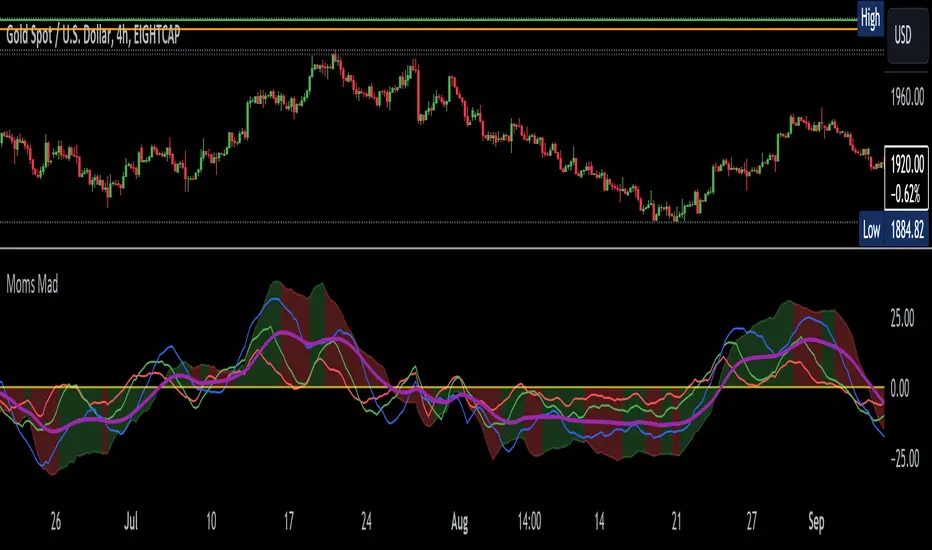
The indicator visualizes the four smoothed momentum values (mom1Smooth, mom2Smooth, mom3Smooth, mom4Smooth) as separate plots on the chart, each with its own customizable color.
A zero line is displayed for reference (yellow).
The average momentum (averageMomentumSmooth) is plotted and can be customized with its own color.
The "Momentum 4" plot dynamically changes color based on trend direction (green for bullish, red for bearish).
Fill:
The indicator fills the area between the "Momentum 4" plot and the zero line with a customizable color to highlight bullish or bearish momentum.
Look for crossover events by studying the chart and understanding what they all mean. Happy trading :)
Open-source Skript
Ganz im Sinne von TradingView hat dieser Autor sein/ihr Script als Open-Source veröffentlicht. Auf diese Weise können nun das Script auch andere Trader verstehen und prüfen. Vielen Dank an den Autor! Sie können das Script kostenlos verwenden. Die Nutzung dieses Codes in einer Veröffentlichung wird in unseren Hausregeln reguliert. Sie können es als Favoriten auswählen, um es in einem Chart zu verwenden.
Möchten Sie dieses Skript auf einem Chart verwenden?
Haftungsausschluss
Die Informationen und Veröffentlichungen sind nicht als Finanz-, Anlage-, Handels- oder andere Arten von Ratschlägen oder Empfehlungen gedacht, die von TradingView bereitgestellt oder gebilligt werden, und stellen diese nicht dar. Lesen Sie mehr in den Nutzungsbedingungen.