PROTECTED SOURCE SCRIPT
VT – Dashboard05
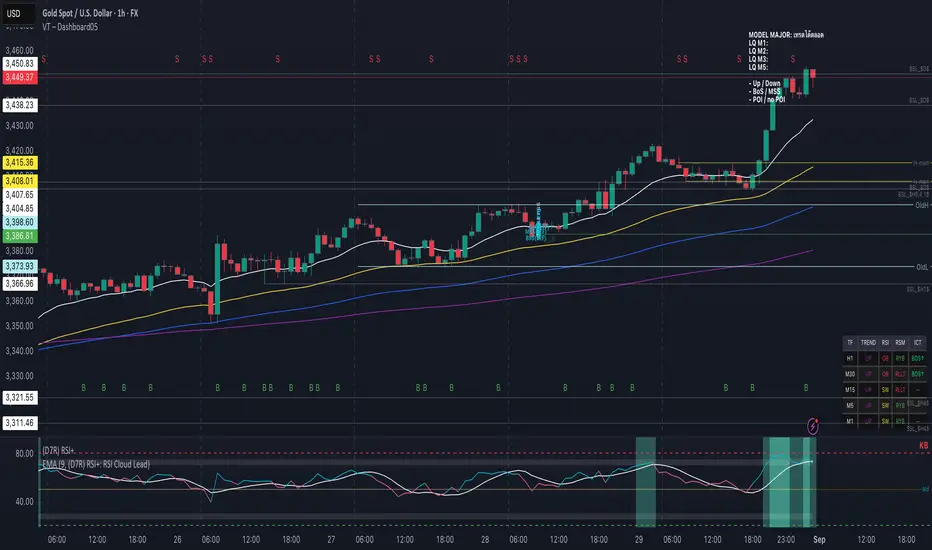
🚀 Overview
VT – Dashboard05 is a multi-timeframe market state dashboard for Forex and other liquid markets. It summarizes Trend, RSI state, RSM, and ICT structure (BOS/MSS) across H1 / M30 / M15 / M5 / M1 in one compact table—plus clean rejection markers (“S” at the top, “B” at the bottom) controlled entirely from the Style tab. All higher-timeframe values are computed without lookahead and only confirm on their candle close.
✨ Key Features
5-TF Dashboard (H1, M30, M15, M5, M1) — Columns for TREND / RSI / RSM / ICT, color-coded for quick reads.
EMA-Stack Trend — Fast/Mid/Slow EMA alignment for Up / Sideways / Down bias.
RSI & RSM States — OB/OS plus RSI vs RSM momentum (RYB / RLLT).
ICT Structure (BOS / MSS) — Choose Close Break or Body Break; signals confirm only on TF close.
Rejection Markers (Style-only) — “S” at top, “B” at bottom; change colors/visibility in Style (no Inputs clutter).
Alerts — State-change alerts for TREND, RSI, RSM, ICT on each TF, plus rejection alerts on the chart TF.
No repaint tricks — HTF data pulled with gaps filled, lookahead off, confirmation on close.
🛠 How to Use
Add to chart → set Dashboard Position (Inputs).
Pick ICT Break Method (Close Break or Body Break).
Tune Structure Swing Length for H1/M30/M15/M5/M1.
(Optional) Toggle EMA1–EMA4 overlays for context.
Style the markers in Settings → Style:
Rejection (Top) → “S” at top (color/visibility here).
Rejection (Bottom) → “B” at bottom (color/visibility here).
Create alerts using built-in conditions (e.g., ICT change H1, TREND change M15, Rejection Bullish (chart TF)).
⚙️ Settings
Dashboard: Dashboard Position, Compact Mode.
Trend: EMA Fast / Mid / Slow Lengths.
RSI: RSI Length, OB/OS Levels.
RSM: RSM RSI Length, RSM EMA Length.
ICT Structure: ICT Break Method (Close vs Body), Structure Swing Length per TF (H1/M30/M15/M5/M1).
EMAs on Chart: EMA1–EMA4 lengths & show/hide.
Style Tab: Rejection (Top) and Rejection (Bottom) series for color/visibility.
📈 Trading Concepts
TREND: EMA stacking—aligned = UP, mixed = SW, bearish stack = DOWN.
RSI: OB > overbought, OS < oversold, else SW.
RSM: RYB when Uptrend, RLLT when Downtrend.
ICT (BOS/MSS):
BOS↑/BOS↓ = break of last swing high/low.
MSS↑/MSS↓ = break against the prior BOS direction (structure shift).
Signals are evaluated with Close Break or Body Break and confirm only on TF close.
Rejection: Bar-based reversal patterns—“S” marks bearish rejection (top), “B” marks bullish rejection (bottom).
Note: This is a technical analysis tool. Always practice proper risk management and combine with other analysis techniques for best results.
Category: Multi-Timeframe / Dashboard / Structure
Version: 1.0
Developer: VT
Geschütztes Skript
Dieses Script ist als Closed-Source veröffentlicht. Sie können es kostenlos und ohne Einschränkungen verwenden – erfahren Sie hier mehr.
Haftungsausschluss
Die Informationen und Veröffentlichungen sind nicht als Finanz-, Anlage-, Handels- oder andere Arten von Ratschlägen oder Empfehlungen gedacht, die von TradingView bereitgestellt oder gebilligt werden, und stellen diese nicht dar. Lesen Sie mehr in den Nutzungsbedingungen.