PROTECTED SOURCE SCRIPT
Aktualisiert Supply/Demand Zone Marker mit Alerts
Supply and Demand Zones Marker. You can costumize the length of the Zone, the Body Wick Ratio and if it automatically revome old Zones.
Versionshinweise
Supply and Demand Zone MarkerVersionshinweise
## 🧭 **Explanation: Supply/Demand Zone Marker with Alerts**### 🧩 **Purpose of the Indicator**
This indicator automatically detects **Supply (resistance)** and **Demand (support)** zones,
draws them directly on the chart, and triggers **alerts** when:
* a new zone is detected,
* the price **touches** a zone, or
* the price **breaks through** a zone.
It helps you identify potential **reversal or reaction areas** in the market and notifies you when price interacts with them.
---
## ⚙️ **How It Works**
The indicator looks for **low-volatility candles** (small bodies) that indicate **accumulation or distribution** phases.
When a **strong impulsive candle** appears afterward, it confirms the zone and plots it on the chart.
---
### 🔍 **1️⃣ Zone Detection Logic**
* A zone is formed when several **small-bodied candles** appear in sequence (a consolidation area).
* Once a **strong confirmation candle** follows (e.g., bullish → demand zone, bearish → supply zone),
the indicator confirms and draws the zone.
* The size of the zone can be calculated either:
* **Wick to Wick** → includes full candle range, or
* **Wick to Body** → focuses on the body area for tighter zones.
---
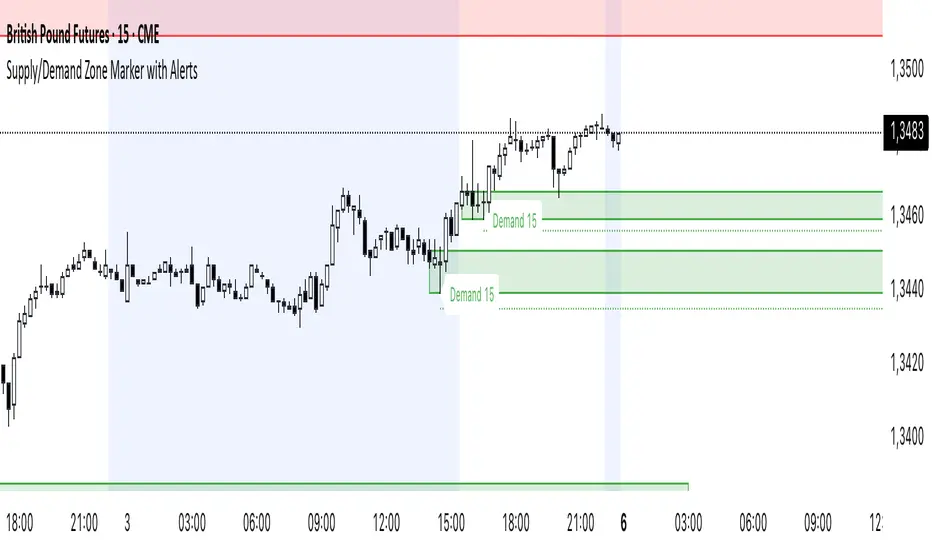
### 🎨 **2️⃣ Visual Representation**
* **Green Zone = Demand Zone (support area)**
→ Expected buying pressure if price returns.
* **Red Zone = Supply Zone (resistance area)**
→ Expected selling pressure if price returns.
* **Dotted Line (Stop-Line)**
→ Marks 33% of the zone size outside — a potential stop-loss guideline.
Each zone includes a **label** (e.g., “Demand 1H”) and remains on the chart until it’s automatically or manually removed.
---
### 🧹 **3️⃣ Automatic Zone Management**
Depending on your settings, the indicator can automatically remove zones when they’re no longer valid.
| Setting | Description |
| --------------------------------------- | ---------------------------------------------------------------------- |
| **Old Zones automatic remove?** | Removes old zones automatically to keep your chart clean. |
| **Delete Zone after Touch?** | Deletes a zone after the price **touches** it once. |
| **Delete Zone after >25% Penetration?** | Deletes a zone after the price **enters more than 25%** into the zone. |
---
### 🚨 **4️⃣ Alerts System**
The indicator comes with built-in TradingView alert conditions.
You can set alerts for the following events:
| Alert Type | Trigger Description |
| ----------------------- | ---------------------------------------------- |
| **New Zone Detected** | A new Supply or Demand zone has formed. |
| **Demand Zone Touched** | Price has touched the top of a Demand zone. |
| **Supply Zone Touched** | Price has touched the bottom of a Supply zone. |
| **Demand Zone Broken** | Price broke **below** a Demand zone. |
| **Supply Zone Broken** | Price broke **above** a Supply zone. |
🔔 **How to enable alerts:**
1. Click the **“Alert” (⚠️)** icon in TradingView.
2. Set **Condition = Supply/Demand Zone Marker**.
3. Choose your desired alert type and delivery method (app, pop-up, email, etc.).
---
## 🛠️ **Input Parameters Explained**
| Category | Parameter | Description |
| ---------------------------- | ------------------------------------------ | ----------------------------------------------------------------------- |
| **Zone Detection** | *Maximum Candles in Zone* | Maximum number of small candles allowed in a single zone. |
| | *Max Body/Wick Ratio in Zone* | Defines what counts as a “small-bodied” candle. Smaller = quieter zone. |
| | *Min. Body/Wick Ratio Confirmation Candle* | How strong the confirmation candle must be. |
| | *Max Zone Size (% of Price)* | Ensures zones don’t exceed a percentage of price. |
| | *Confirmation Candle bigger than Zone?* | The confirming candle must be larger than the zone. |
| **Display** | *Zone Transparency* | Adjusts zone opacity (0 = opaque, 100 = invisible). |
| | *Zone Size Calculation* | Choose “Wick to Wick” or “Wick to Body”. |
| | *Show 33% Stop-Line?* | Displays a stop guide line below/above the zone. |
| **Colors** | *Supply Color / Demand Color* | Customize zone colors. |
| **Auto-Management & Alerts** | *Old Zones automatic remove?* | Auto-deletes old zones. |
| | *Delete Zone after Touch?* | Removes zone after the first touch. |
| | *Delete Zone after >25% Penetration?* | Removes zone if price enters deeply into it. |
| | *Alerts* | Notify on touch/break/new zone creation. |
---
## 📈 **How to Use It**
1. **Add the indicator:**
* Open TradingView → *Indicators* → *New Script* → Paste the code → *Save & Add to Chart*.
2. **Select your timeframe:**
* Works on all timeframes (1m to 1D+).
3. **Adjust settings:**
* Higher volatility → increase *Max Zone Size*.
* Quiet markets → lower body ratio limits.
4. **Set alerts:**
* Via the ⚠️ icon → choose your preferred condition.
5. **Trading concept:**
* Enter when price **retests a zone** and shows reaction (rejection candle).
* Stop-loss just outside the zone (or on the dotted stop line).
* Take profit at next opposing zone or prior swing high/low.
---
## 💡 **Pro Tip**
For advanced users, load multiple instances of this indicator:
* One on **higher timeframe (e.g. 1H)** → major zones.
* One on **lower timeframe (e.g. 15m)** → refined entry zones.
This gives you a **multi-timeframe Supply & Demand view**, ideal for timing entries within larger structures.
Versionshinweise
🧭 Explanation: Supply/Demand Zone Marker with Alerts🧩 Purpose of the Indicator
This indicator automatically detects Supply (resistance) and Demand (support) zones,
draws them directly on the chart, and triggers alerts when:
a new zone is detected,
the price touches a zone, or
the price breaks through a zone.
It helps you identify potential reversal or reaction areas in the market and notifies you when price interacts with them.
⚙️ How It Works
The indicator looks for low-volatility candles (small bodies) that indicate accumulation or distribution phases.
When a strong impulsive candle appears afterward, it confirms the zone and plots it on the chart.
🔍 1️⃣ Zone Detection Logic
A zone is formed when several small-bodied candles appear in sequence (a consolidation area).
Once a strong confirmation candle follows (e.g., bullish → demand zone, bearish → supply zone),
the indicator confirms and draws the zone.
The size of the zone can be calculated either:
Wick to Wick → includes full candle range, or
Wick to Body → focuses on the body area for tighter zones.
🎨 2️⃣ Visual Representation
Green Zone = Demand Zone (support area)
→ Expected buying pressure if price returns.
Red Zone = Supply Zone (resistance area)
→ Expected selling pressure if price returns.
Dotted Line (Stop-Line)
→ Marks 33% of the zone size outside — a potential stop-loss guideline.
Each zone includes a label (e.g., “Demand 1H”) and remains on the chart until it’s automatically or manually removed.
🧹 3️⃣ Automatic Zone Management
Depending on your settings, the indicator can automatically remove zones when they’re no longer valid.
Setting Description
Old Zones automatic remove? Removes old zones automatically to keep your chart clean.
Delete Zone after Touch? Deletes a zone after the price touches it once.
Delete Zone after >25% Penetration? Deletes a zone after the price enters more than 25% into the zone.
🚨 4️⃣ Alerts System
The indicator comes with built-in TradingView alert conditions.
You can set alerts for the following events:
Alert Type Trigger Description
New Zone Detected A new Supply or Demand zone has formed.
Demand Zone Touched Price has touched the top of a Demand zone.
Supply Zone Touched Price has touched the bottom of a Supply zone.
Demand Zone Broken Price broke below a Demand zone.
Supply Zone Broken Price broke above a Supply zone.
🔔 How to enable alerts:
Click the “Alert” (⚠️) icon in TradingView.
Set Condition = Supply/Demand Zone Marker.
Choose your desired alert type and delivery method (app, pop-up, email, etc.).
🛠️ Input Parameters Explained
Category Parameter Description
Zone Detection Maximum Candles in Zone Maximum number of small candles allowed in a single zone.
Max Body/Wick Ratio in Zone Defines what counts as a “small-bodied” candle. Smaller = quieter zone.
Min. Body/Wick Ratio Confirmation Candle How strong the confirmation candle must be.
Max Zone Size (% of Price) Ensures zones don’t exceed a percentage of price.
Confirmation Candle bigger than Zone? The confirming candle must be larger than the zone.
Display Zone Transparency Adjusts zone opacity (0 = opaque, 100 = invisible).
Zone Size Calculation Choose “Wick to Wick” or “Wick to Body”.
Show 33% Stop-Line? Displays a stop guide line below/above the zone.
Colors Supply Color / Demand Color Customize zone colors.
Auto-Management & Alerts Old Zones automatic remove? Auto-deletes old zones.
Delete Zone after Touch? Removes zone after the first touch.
Delete Zone after >25% Penetration? Removes zone if price enters deeply into it.
Alerts Notify on touch/break/new zone creation.
📈 How to Use It
Add the indicator:
Open TradingView → Indicators → New Script → Paste the code → Save & Add to Chart.
Select your timeframe:
Works on all timeframes (1m to 1D+).
Adjust settings:
Higher volatility → increase Max Zone Size.
Quiet markets → lower body ratio limits.
Set alerts:
Via the ⚠️ icon → choose your preferred condition.
Trading concept:
Enter when price retests a zone and shows reaction (rejection candle).
Stop-loss just outside the zone (or on the dotted stop line).
Take profit at next opposing zone or prior swing high/low.
💡 Pro Tip
For advanced users, load multiple instances of this indicator:
One on higher timeframe (e.g. 1H) → major zones.
One on lower timeframe (e.g. 15m) → refined entry zones.
This gives you a multi-timeframe Supply & Demand view, ideal for timing entries within larger structures.
Geschütztes Skript
Dieses Script ist als Closed-Source veröffentlicht. Sie können es kostenlos und ohne Einschränkungen verwenden – erfahren Sie hier mehr.
Haftungsausschluss
Die Informationen und Veröffentlichungen sind nicht als Finanz-, Anlage-, Handels- oder andere Arten von Ratschlägen oder Empfehlungen gedacht, die von TradingView bereitgestellt oder gebilligt werden, und stellen diese nicht dar. Lesen Sie mehr in den Nutzungsbedingungen.