PROTECTED SOURCE SCRIPT
Aktualisiert Bollinger + MMA + EMA + Zones Importantes
Indicator for trading volatility.
It includes many options such as:
- up to 3 customizable bollinger bands
- the famous magic bollinger band (only in UT 5min) (I will work on this option to make it even more perfectible)
- up to 5 customizable moving averages (with the possibility of putting a colored backround during crossings)
- up to 3 customizable exponential moving averages.
This indicator, associated with my indicator "MACD ZERO RETARD + ZONES IMPORTANTE" will allow you to draw your attention to areas of interest and thus work on your positions. Works on intraday, medium and long term (to be determined if it also works for scalping).
Versionshinweise
DAX - TF min, with BBmagicshttps://www.tradingview.com/x/JQ6pI4GA/
Versionshinweise
BTC - WEEKLYTop and bottom detection
https://www.tradingview.com/x/gUTofi7W/
Versionshinweise
Backround optimization for important areasVersionshinweise
Important update- integration of multitime frame for bollinger bands*
- scheduling in the settings
- magic bollinger bands only visible from m5 Timeframe
- optimization of important areas
* Auto mutlti-timeframe BB settings:
m1 - m5 - m15
m2 - m5 - m15
m3 - m15 - h1
m5 - m15 - h1
m10 - m30 - h1
m15 - h1 - h4
m30 - h2 - h4
h1 - h4 - D
h2 - h8 - D
h4 - D - W
D-W-M
W-M-3M
You also keep the possibility to manually adjust the desired timeframe
Versionshinweise
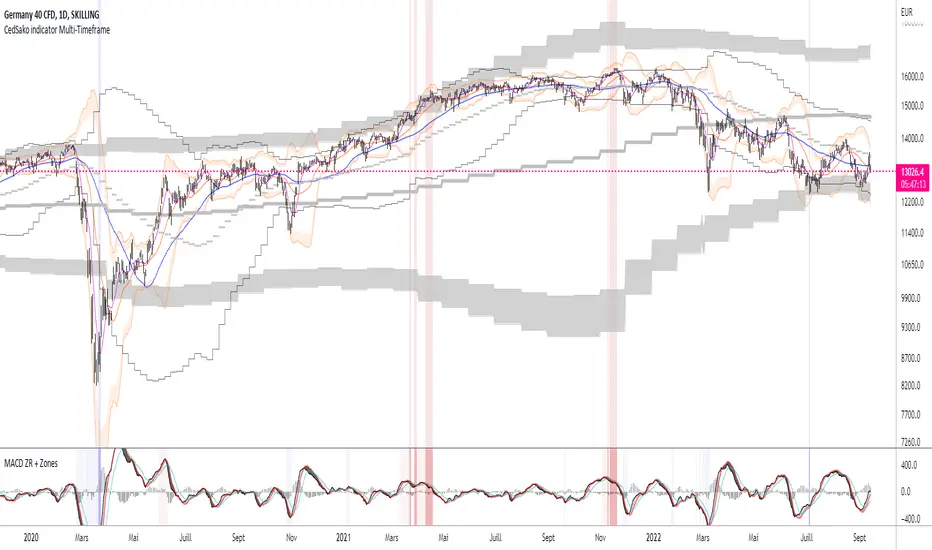
Reference TF = Orange BBsTF+1 = black lines
TF+2 = gray bands on the graph
Versionshinweise
MAJ graphique de présentationGeschütztes Skript
Dieses Script ist als Closed-Source veröffentlicht. Sie können es kostenlos und ohne Einschränkungen verwenden – erfahren Sie hier mehr.
Haftungsausschluss
Die Informationen und Veröffentlichungen sind nicht als Finanz-, Anlage-, Handels- oder andere Arten von Ratschlägen oder Empfehlungen gedacht, die von TradingView bereitgestellt oder gebilligt werden, und stellen diese nicht dar. Lesen Sie mehr in den Nutzungsbedingungen.
Geschütztes Skript
Dieses Script ist als Closed-Source veröffentlicht. Sie können es kostenlos und ohne Einschränkungen verwenden – erfahren Sie hier mehr.
Haftungsausschluss
Die Informationen und Veröffentlichungen sind nicht als Finanz-, Anlage-, Handels- oder andere Arten von Ratschlägen oder Empfehlungen gedacht, die von TradingView bereitgestellt oder gebilligt werden, und stellen diese nicht dar. Lesen Sie mehr in den Nutzungsbedingungen.