OPEN-SOURCE SCRIPT
Distance from MA (%)
Purpose:
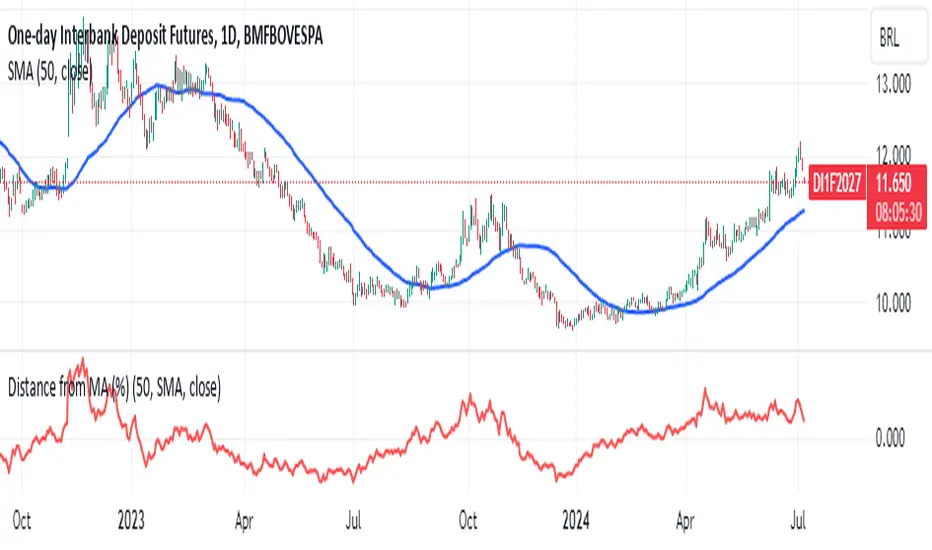
This indicator calculates and plots the distance in percentage between the current price and a specified moving average. The distance is displayed in a separate window below the main price chart.
Features:
Configurable Moving Average Period: You can set the period for the moving average calculation.
Multiple Moving Average Methods: The indicator supports various moving average methods, including Simple Moving Average (SMA), Exponential Moving Average (EMA), Weighted Moving Average (WMA), and Volume Weighted Moving Average (VWMA).
Applied Price Selection: You can choose which price to use for the moving average calculation (e.g., close, open, high, low, etc.).
Parameters:
MA Period: The number of periods to use for the moving average calculation.
MA Method: The type of moving average to use (SMA, EMA, WMA, VWMA).
Applied Price: The price used for the moving average calculation.
Calculation:
Moving Average Calculation:
Depending on the selected method, the indicator calculates the moving average (MA) value for each bar using the specified period and applied price.
Distance in Percentage:
The distance is calculated as the difference between the current price and the moving average value, divided by the moving average value, and then multiplied by 100 to convert it to a percentage.
Formula: Distance %=(Applied Price−MA ValueMA Value)×100Distance %=(MA ValueApplied Price−MA Value)×100
Plotting:
The indicator plots the calculated distance in percentage as a line in a separate window below the main chart. The plot is colored red and has a linewidth of 2 for better visibility.
Open-source Skript
Ganz im Sinne von TradingView hat dieser Autor sein/ihr Script als Open-Source veröffentlicht. Auf diese Weise können nun auch andere Trader das Script rezensieren und die Funktionalität überprüfen. Vielen Dank an den Autor! Sie können das Script kostenlos verwenden, aber eine Wiederveröffentlichung des Codes unterliegt unseren Hausregeln.
Haftungsausschluss
Die Informationen und Veröffentlichungen sind nicht als Finanz-, Anlage-, Handels- oder andere Arten von Ratschlägen oder Empfehlungen gedacht, die von TradingView bereitgestellt oder gebilligt werden, und stellen diese nicht dar. Lesen Sie mehr in den Nutzungsbedingungen.