PROTECTED SOURCE SCRIPT
Aktualisiert BB NWOG - NDOG - RTH NDOG

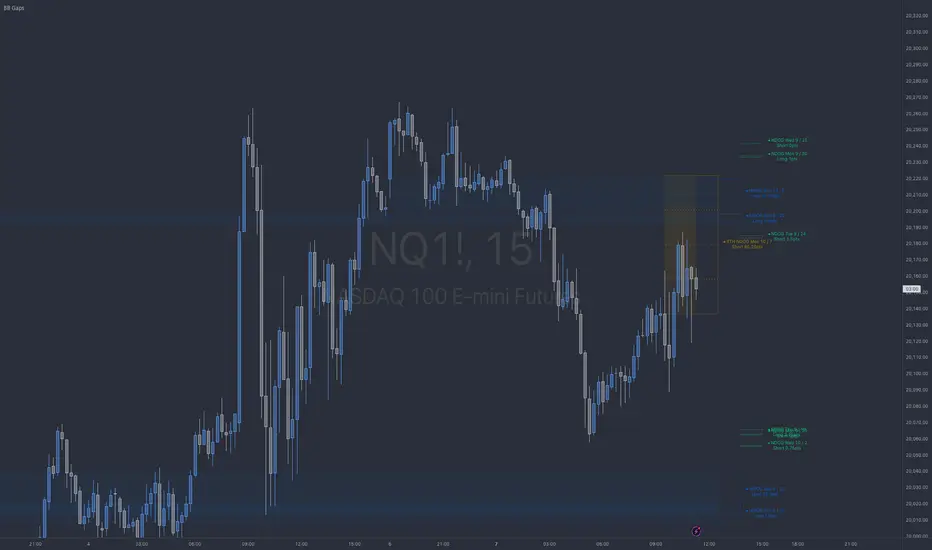
The BB Gaps Indicator is a comprehensive tool designed for traders looking to track and visualize significant opening gaps within various market sessions, including:
• New Day Opening Gaps (NDOGs): These gaps form between the closing price of the previous day and the opening price of the new day, providing insight into potential liquidity pools or imbalances.
• RTH New Day Opening Gaps (RTH NDOGs): This focuses on gaps that occur during Regular Trading Hours (RTH), capturing gaps between session closures and the next day’s open, ideal for intraday traders.
• New Week Opening Gaps (NWOGs): These gaps track the price differential between the last candle of the week and the first candle of the new trading week, providing a broader market perspective for swing traders.
Key Features:
• Dynamic Plotting: Visualize gaps with customizable extensions, box fills, and mid-range (50%) or quarter-range (25%, 75%) levels.
• Sidecar Labels: Handy sidecar labels display the gap information right on the chart for easy reference.
• Multiple Session Support: Track gaps across different trading sessions (Daily, RTH, Weekly) with adjustable plot extensions and fill styles.
• Configurable Limits: Set a maximum number of gaps to plot, ensuring your chart remains clean and clutter-free.
Versionshinweise
Bug Fixes:-Crashing below 1min charts
-RTH NDOG opening at 9:14 not 9:30
-max gap to plot calculation
Additions:
-day name label
-direction calculation
-size in pts calculation
-line size & type user input
Versionshinweise
fixed bug with sub 1min timeframeVersionshinweise
🚀 BB Gaps Indicator Update 🚀• Added timezone selector for better flexibility across markets.
• New option to display average gap size (default 60 periods, adjustable).
• Option to limit the number of sidecars displayed.
• Forming RTH sidecar gap after midnight (confirms at RTH open).
• Minor bug fixes and enhancements.
Versionshinweise
• Fixed an issue with the RTH New Day Opening Gap (NDOG) pre market formation logic.• Added the ability to customize the color of the most recent New Week Opening Gap (NWOG).
• Added the ability to change the color of Monday’s New Day Opening Gap (NDOG) for better visibility.
• Pinescript v6 upgrade. Minor bug fixes and improvements to stability and gap plotting accuracy.
Known Issues
• Holiday market hours and contract rollovers may cause improper gap plotting. This will be addressed in a future update.
Versionshinweise
Fixed issue with the gap plots multiplying on the chart. Something change with the way barstate.islast is handled in pineScript.Versionshinweise
Fixed issue with Monday NDOG colorVersionshinweise
fixed problem with Monday NDOG color. we will not be able to hide the gap with transparent color at this time. We've added a checkbox to hide Monday's gap if you so chooseGeschütztes Skript
Dieses Script ist als Closed-Source veröffentlicht. Sie können es kostenlos und ohne Einschränkungen verwenden – erfahren Sie hier mehr.
Haftungsausschluss
Die Informationen und Veröffentlichungen sind nicht als Finanz-, Anlage-, Handels- oder andere Arten von Ratschlägen oder Empfehlungen gedacht, die von TradingView bereitgestellt oder gebilligt werden, und stellen diese nicht dar. Lesen Sie mehr in den Nutzungsbedingungen.
Geschütztes Skript
Dieses Script ist als Closed-Source veröffentlicht. Sie können es kostenlos und ohne Einschränkungen verwenden – erfahren Sie hier mehr.
Haftungsausschluss
Die Informationen und Veröffentlichungen sind nicht als Finanz-, Anlage-, Handels- oder andere Arten von Ratschlägen oder Empfehlungen gedacht, die von TradingView bereitgestellt oder gebilligt werden, und stellen diese nicht dar. Lesen Sie mehr in den Nutzungsbedingungen.