PROTECTED SOURCE SCRIPT
Equilibrium Range
Equilibrium Range Indicator
The Equilibrium Range Indicator is a powerful tool designed to assist traders in identifying key market equilibrium zones. By dynamically plotting ranges derived from critical market levels, this indicator provides actionable insights for trade entries, exits, and position management. It is particularly suited for traders who focus on intraday price action and rely on understanding market structure for decision-making.
How the Indicator Works
High-Timeframe Structural Equilibrium (Structural EQ)
This level is calculated by identifying the largest visible swing high and swing low on the 5-minute chart.
It represents the structural price equilibrium, where market sentiment is balanced between buyers and sellers.
Previous Day's Equilibrium (Historical EQ)
Derived from the midpoint of the previous day's high and low prices.
Acts as a historical reference point for potential support or resistance zones.
Dynamic Range Construction
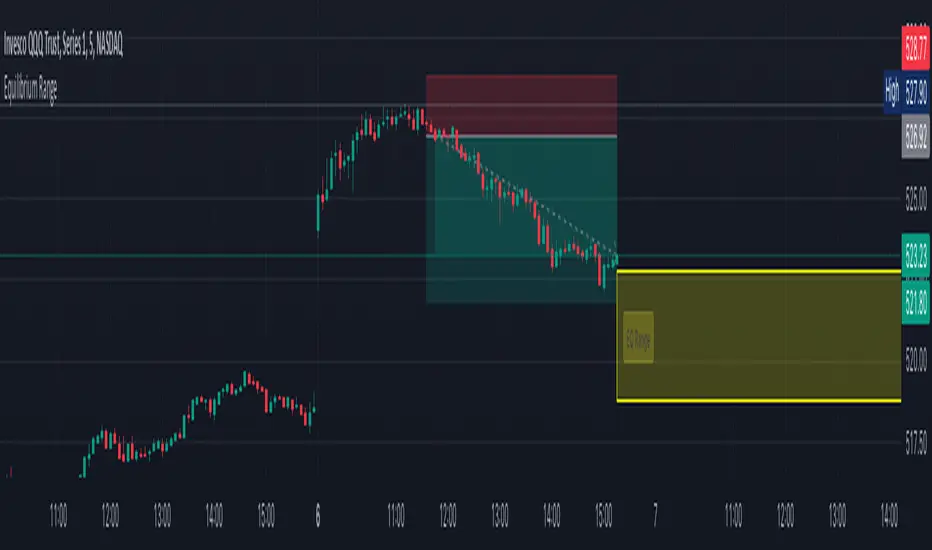
The indicator combines the Structural EQ and the Historical EQ to create an Equilibrium Range.
This range is visually displayed on the chart as a transparent yellow rectangle, ensuring clear and immediate recognition.
Extension and Labeling
The equilibrium range extends infinitely to the right, keeping it relevant for ongoing price action.
A labeled "EQ Range" inside the rectangle ensures traders can quickly identify its purpose.
How to Use the Indicator
Consolidation Zones
The Equilibrium Range helps identify areas where price is likely to consolidate, aiding in avoiding trades during periods of low volatility.
Trade Entries and Exits
Use the upper and lower bounds of the range as guides for setting take-profit and stop-loss levels.
Ideal for scaling in and out of trades based on how price interacts with the range.
Market Sentiment and Breakouts
Observe how price behaves relative to the range:
Breakouts above the range may signal bullish momentum.
Breakouts below the range may indicate bearish trends.
Why It's Original
This indicator stands out by combining multiple concepts of equilibrium into a single, coherent visualization. Unlike traditional support/resistance indicators, the Equilibrium Range Indicator dynamically adapts to market structure while integrating historical context, providing traders with a unique perspective for analyzing price action.
Geschütztes Skript
Dieses Script ist als Closed-Source veröffentlicht. Sie können es kostenlos und ohne Einschränkungen verwenden – erfahren Sie hier mehr.
Haftungsausschluss
Die Informationen und Veröffentlichungen sind nicht als Finanz-, Anlage-, Handels- oder andere Arten von Ratschlägen oder Empfehlungen gedacht, die von TradingView bereitgestellt oder gebilligt werden, und stellen diese nicht dar. Lesen Sie mehr in den Nutzungsbedingungen.