Convergence/divergence indicator
Class: arbitrage oscillator
Trading type: intraday trading
Time frame: 1 hour
Purpose: trading on divergence
Level of aggressiveness: standard
Arbitrage - several logically related transactions aimed at profit from the difference in prices for the same or related assets at the same time in different markets.
Pair trading is a trading strategy based on trading a pair of financial instruments that have some fundamental or statistical relationship, expressed in the fact that the price ratio of these instruments tends to return to a certain average value in the long term.
“Convergence/divergence indicator (CDI)” using correlation analysis from different time frames provides information about statistical relationship between pair of assets.
Correaltion - a statistical relationship between two variables, showing that a larger value (in the case of positive, direct correlation) or a smaller (in the case of negative, inverse correlation) corresponds to a larger value of one value in a certain part of the cases.
The correlation coefficient is a statistical measure of the strength of the relationship between the relative movements of two variables.
The values range between -1.0 and 1.0.
A correlation of -1.0 shows a perfect negative correlation, while a correlation of 1.0 shows a perfect positive correlation.
A correlation of 0.0 shows no linear relationship between the movement of the two variables.
“Convergence/divergence indicator (CDI)” a) allows to find assets where pair arbitrage is possible and determines the moments in time and prices when the conditions for pair arbitrage are ideal.
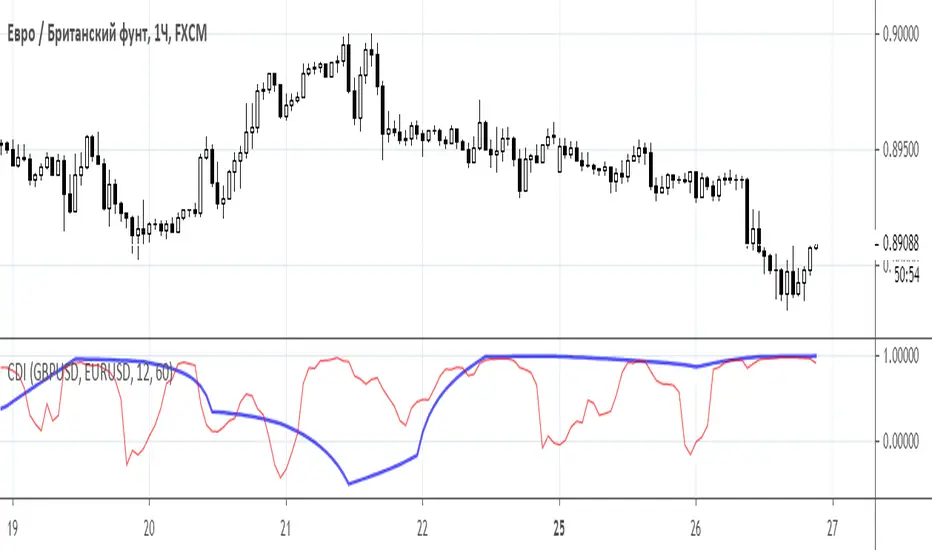
“Convergence/divergence indicator (CDI)” evaluates the statistical relationship between pair of assets in a particular period of time and, if it is available, seeks for the divergence in price fluctuations of these “identical” assets.
“Convergence/divergence indicator (CDI)” displays the current value and dynamics of the Pearson correlation coefficient for a pair of selected assets based on daily (thick blue line) and hourly (thin red line) data.
Basic parameters:
- asset 1 (name of the trading instrument 1);
- asset 2 (name of the trading instrument 2);
- period_d (number of periods used to calculate daily correlation).
- period_h (number of periods used to calculate hourly correlation).
To gain the access to this indicator, please, send a private message to Trade24Fx.
Generator of alerts is added.
Additional variable are incorporated:
- Hourly correlation bottom - responsible for the alert, when hourly correlation goes below threshold (0.2 by default)
- Hourly correlation top - responsible for the alert, when hourly correlation goes above threshold (0.7 by default)
In case of alert function activation indicator will initate an alert if hourly corelation is below "Hourly correlation bottom" or if hourly corelation is above "Hourly correlation top."
Skript nur auf Einladung
Ausschließlich Nutzer mit einer Erlaubnis des Autors können Zugriff auf dieses Script erhalten. Sie müssen diese Genehmigung bei dem Autor beantragen. Dies umfasst üblicherweise auch eine Zahlung. Wenn Sie mehr erfahren möchten, dann sehen Sie sich unten die Anweisungen des Autors an oder kontaktieren Sie Trade24Fx direkt.
TradingView empfiehlt NICHT, für die Nutzung eines Scripts zu bezahlen, wenn Sie den Autor nicht als vertrauenswürdig halten und verstehen, wie das Script funktioniert. Sie können außerdem auch kostenlose Open-Source-Alternativen in unseren Community-Scripts finden.
Hinweise des Autors
bit.ly/2oBvkHY
Больше информации на нашем ютьюб-канале
youtube.com/channel/UCYEOurJfasXWyYnrriGwsqQ
Haftungsausschluss
Skript nur auf Einladung
Ausschließlich Nutzer mit einer Erlaubnis des Autors können Zugriff auf dieses Script erhalten. Sie müssen diese Genehmigung bei dem Autor beantragen. Dies umfasst üblicherweise auch eine Zahlung. Wenn Sie mehr erfahren möchten, dann sehen Sie sich unten die Anweisungen des Autors an oder kontaktieren Sie Trade24Fx direkt.
TradingView empfiehlt NICHT, für die Nutzung eines Scripts zu bezahlen, wenn Sie den Autor nicht als vertrauenswürdig halten und verstehen, wie das Script funktioniert. Sie können außerdem auch kostenlose Open-Source-Alternativen in unseren Community-Scripts finden.
Hinweise des Autors
bit.ly/2oBvkHY
Больше информации на нашем ютьюб-канале
youtube.com/channel/UCYEOurJfasXWyYnrriGwsqQ