PROTECTED SOURCE SCRIPT
Session High/Low Marker Advanced -> PROFABIGHI_CAPITAL
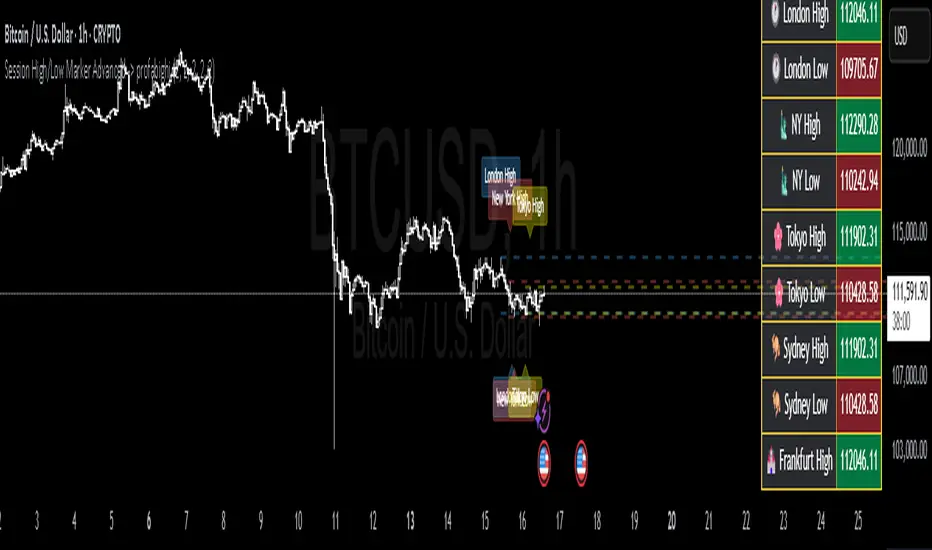
🌟 Overview
The Session High/Low Marker Advanced → PROFABIGHI_CAPITAL indicator tracks and visualizes the highest and lowest prices during major global trading sessions, helping traders identify key support/resistance levels formed in each period.
It supports live updates for active sessions and post-session lines with labels, plus a summary table for quick reference across markets like forex or indices.
👁️ Display Options
– Show London Session: Toggle visibility of London high/low markers for European market opens.
– Show New York Session: Enable markers for New York volatility and trend continuations.
– Show Tokyo Session: Activate Tokyo levels for Asian session analysis.
– Show Sydney Session: Optional markers for early Pacific trading influences.
– Show Frankfurt Session: Include Frankfurt for pre-London European insights.
– Show Session Table: Display a compact overview of all session extremes.
– Live Mode: Update highs/lows in real-time during sessions, rather than finalizing at close.
🎨 Session Styles
– London/New York/Tokyo/Sydney/Frankfurt Line Color: Custom transparency and hues for each session's lines and labels.
– Line Width: Adjustable thickness for session high/low extensions to match chart clarity.
📊 Table Styles
– Accent/Bull/Bear/Neutral Colors: Tints for table headers, positive/negative values, and balanced readings.
⏰ Session Detection
– Time-Based Boundaries: Defines sessions in UTC—London (08:00-17:00), New York (13:00-22:00), Tokyo (00:00-09:00), Sydney (22:00-07:00 next day), Frankfurt (07:00-16:00)—adjusting for date transitions.
– Start/End Triggers: Detects session openings and closings to reset or finalize high/low tracking.
🔄 Session Updates
– High/Low Tracking: Continuously monitors price extremes within each active session, storing bar indices for precise labeling.
– Live Visualization: Draws temporary solid lines and labels during sessions when enabled, updating on every bar.
– Post-Session Finalization: Switches to dashed extending lines and fixed labels at session end for historical reference.
📊 Session Table
– Dynamic Summary: Right-side panel listing high/low values per session with color-coded cells—bullish green for highs, bearish red for lows, neutral gray for inactive.
– Real-Time Refresh: Updates on the last bar to reflect current or completed session data.
🔔 Alerts
– High/Low Breaks: Notifies when price crosses above a session high or below a low for breakout opportunities.
– Session Starts: Announces openings of selected sessions for timing entries.
✅ Key Takeaways
– Pinpoints intraday support/resistance from global sessions to frame trades.
– Live mode enables real-time monitoring, while post-session lines aid planning.
– Custom colors and table condense multi-session data for efficient scanning.
– Alerts on breaks keep traders responsive to session-driven volatility.
Geschütztes Skript
Dieses Script ist als Closed-Source veröffentlicht. Sie können es kostenlos und ohne Einschränkungen verwenden – erfahren Sie hier mehr.
Haftungsausschluss
Die Informationen und Veröffentlichungen sind nicht als Finanz-, Anlage-, Handels- oder andere Arten von Ratschlägen oder Empfehlungen gedacht, die von TradingView bereitgestellt oder gebilligt werden, und stellen diese nicht dar. Lesen Sie mehr in den Nutzungsbedingungen.