PROTECTED SOURCE SCRIPT
Aktualisiert GreyPool VSA Spread/Wick Divergence Indicator
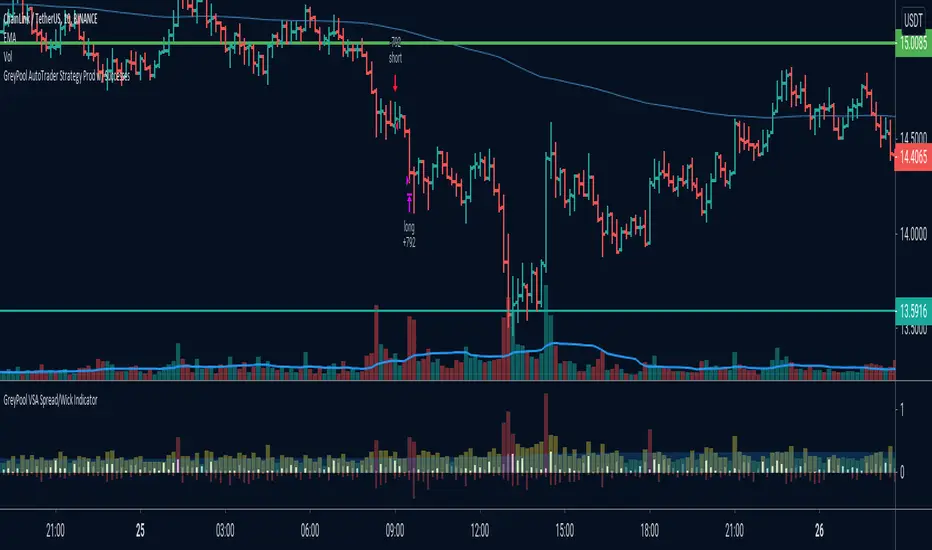
The purpose of this indicator is to determine the distance between the spread of a bar/candle and the wick at a glance (Spread is defined as the range between the open and close and the wick is any part of the bar/candle that is beyond that range).
Climactic action bars typically have large spreads and a pronounced wick which indicates hidden buying or selling.
Definitions of Colors:
Light Blue Area - Average spread size of the last x bars where x is the set MA period
Red Column - Indicates a very high spread that is far beyond the average
Yellow Column - Indicates spreads that are at the average line or just above it
Green Column - Indicates a very low spread
Thin Red Histogram - Indicates the size of the bottom wick (Either the distance between the close and low of down bars or the open and low or up bars)
Thin Blue Histogram - Indicates the size of the top wick (Either the distance between the open and high for down bars or the close and high for up bars)
*** Please Click The LIKE Button to Support Us, Thank You ***
Versionshinweise
Changed "Thin Blue Histogram" line to whiteUsage:
More or less like a spread Delta, there is the possibility of looking at "trending" spread changes. For example, if the last 50 bars shows up bars with longer wicks and spreads and down bars with shorter wicks and smaller spreads it could be deduced that there is less resistance to the down side
Versionshinweise
Added the ability to switch between the spread calculated as the difference between high and low or the difference between close and openVersionshinweise
Changed default Spread option to H-LGeschütztes Skript
Dieses Script ist als Closed-Source veröffentlicht. Sie können es kostenlos und ohne Einschränkungen verwenden – erfahren Sie hier mehr.
GreyPool.io
Try our automated trading strategies at: greypool.io
Try our automated trading strategies at: greypool.io
Haftungsausschluss
Die Informationen und Veröffentlichungen sind nicht als Finanz-, Anlage-, Handels- oder andere Arten von Ratschlägen oder Empfehlungen gedacht, die von TradingView bereitgestellt oder gebilligt werden, und stellen diese nicht dar. Lesen Sie mehr in den Nutzungsbedingungen.
Geschütztes Skript
Dieses Script ist als Closed-Source veröffentlicht. Sie können es kostenlos und ohne Einschränkungen verwenden – erfahren Sie hier mehr.
GreyPool.io
Try our automated trading strategies at: greypool.io
Try our automated trading strategies at: greypool.io
Haftungsausschluss
Die Informationen und Veröffentlichungen sind nicht als Finanz-, Anlage-, Handels- oder andere Arten von Ratschlägen oder Empfehlungen gedacht, die von TradingView bereitgestellt oder gebilligt werden, und stellen diese nicht dar. Lesen Sie mehr in den Nutzungsbedingungen.